1. Introduction
Padel rackets are generally composed of a fiberglass or carbon outer frame with a foam or EVA interior sandwiched between two graphite or fiberglass surfaces. Much is claimed and believed about the contributions of materials, thickness, surface and core compressibility, and overall stiffness to the enhancement of power of the racket. Racket manufacturers continuously produce and advertise new rackets as having new technologies that increase power. But is inherent racket power an infinite well from which more power can be forever extracted? If so, how much? Can players actually perceive the difference? Without measurement, making sense of all this is difficult. This experiment does just that.
This experiment uses a dynamic procedure to test these properties. Ball and racket deformation acts like a rubber band — it stores deformation energy as elastic energy and returns a portion of that to the rebound of the colliding objects. This experiment measures and tracks the flow of this deformation energy to determine its contribution to rebound velocity ("power"). The experiment will determine the impact properties of the racket alone, ball alone, and racket and ball together. These properties are measured and calculated when the racket is in a clamped, stationary condition. These properties are then used to calculate the rebound "power potential" of balls rebounding from rackets during free, unsecured impacts. Five racket and ball properties are especially important in following the energy flow resulting in rebound ball velocity — stiffness, effective mass, incident velocity, coefficient of restitution, and apparent coefficient of restitution. In all the calculations below, the ratio of the racket property to the ball property will be important.
1.1. Stiffness and Stiffness Ratio
The resistance to deformation is measured as stiffness, k. Deformation in this experiment is the combination of local surface compression and transverse bending of the racket head between the tip and throat clamps during impact with a test apparatus (Figure 1). Stiffness is given as

where F is the force and x is the transverse displacement of the impact point and k the stiffness. Stiffness is typically measured in N/m, N/mm, or lb/in. As such, stiffness is a measure of how much force (newtons or pounds) is needed to deform the racket 1 meter or 1 mm or 1 inch. In the energy flow calculations below, it is the relative stiffness of the racket to ball (kr / kb) that is important.
1.2. Effective Mass and Mass Ratio
The greater an object's mass the more difficult it is to lift. This resistance to linear motion is measured as weight. A rod with a mass on the opposite end from your hand is more difficult to swing in a circle than one without mass. This resistance to rotational motion about an axis is measured as moment of inertia (in racquet sports terminology, "swingweight" or "twistweight", depending on the axis). At any given impact location on the racket, the weight, swingweight, and twistweight combine into an "effective" mass (in sports terminology, "hittingweight") of that impact location. It is calculated "as if" the ball impacted with a discrete point with a mass equal to the hittingweight. The hittingweight is always less than the actual weight, unless the impact is at the center of mass (balance point) of the racket, where it is equal to the mass. Upon impact, larger hittingweights result in less energy loss due to racket recoil, rotation, and twisting than than do smaller hittingweights. The hittingweight (Me) for a ball impacting along the center axis from tip to butt is given as
where M is the mass of the racket, Icm is the swingweight around an axis through the center of mass (balance point), and b is the distance from the impact point to the balance point. In this experiment, Me is calculated for impacts in the center of the racket head.
The effective mass of the ball is taken as its mass. Being round, the impact point is always the same distance from the CM, and changes in its Icm due to deformation during impact are small and insignificant in our calculations.
The ratio of masses is very important in determining energy flow and it appears in several guises in the calculations. The primary mass ratio is that of the racket effective mass at a given impact location to the ball mass. The mass ratio is presented in two ways — as the mass relation of the racket to the ball (Me / m), or as the mass relation of the racket to the total mass (Mt) of the collision Me / (Me + m). The ratios can also presented in terms of the ball to the racket: m / Me and m / (Me + m). A ratio of 5 to 1 interprets in several ways: that the racket is 5 times more massive than the ball, or the racket has 5 parts and the ball 1 part of the 6-part whole, or the racket is 5/6 = 0.833 of the whole and the ball is 1/6 = 0.167. One last way to visualize the mass ratio is this: if Me=5m, m = 1m, and Mt = 6m, then Me / m = (5m / 6m) / (1m / 6m) = 5/1. These ratios appear frequently in velocity and energy calculations and are essential to determining the type, amount, and location of energy during impact. In calculations, the ratios act to distribute shares of a value, property, or variable in inverse proportion to the mass ratio. In other words, if the mass ratio is 5/1 (e.g., 290g / 58g = 5), then if you see VMe / (Me + m) in a calculation, that means that 0.833 (or 83.3%) of racket velocity will be transferred to the ball with its mass of 58g, and 0.167 (or 16.7%) of the ball velocity will be transferred to the racket with its 290g of mass. Thus the transfer of momentums (mass times velocity) will be equal.
1.3. Coefficient of Restitution (COR)
The coefficient of restitution (COR, or e) is the ratio of the separation speed to the approach speed of the two colliding objects (i.e., separation speed / approach speed). COR is given as
where Vy1 and vy1 are the incident speeds of the racket and ball respectively, Vy2 and vy2 are their rebound speeds, the subscript y indicates perpendicular to the surface, subscripts 1 and 2 indicate incident and rebound, and the leading minus sign corrects for change in direction of the ball, whose incident speed will be given as negative in the experiment and calculations. (Notes: (a) upper case letters are used for the racket and lower case for the ball; (b) when context may be confusing or when we are talking about the ball or racket in isolation, we will denote the COR of the racket as er, the ball as eb, and combined as ec; (c) in most equations that follow, it is assumed that impacts and rebounds are perpendicular to the surface so the "y" subscript is eliminated).
Rearranging Eq. 3a, we see that COR times the approach speed equals the separation speed (Equation 3b).
In order to measure the COR of the racket alone (er), the experimental apparatus (described in Section 2 and shown in Figure 1) secures the racket in place such that during an impact the only change in velocity is that of the impact mass — the racket's velocity is zero before and after the collision. The COR ratio then simplifies to the rebound speed divided by the incident speed of the impact mass — i.e., er = -vy2 / vy1. COR has values between 0 and 1.0.
Although COR is a ratio of velocities before and after the collision, it is also used to measure potential energy return — the fraction of energy returned from that stored elastically (potentially) due to the deformation of the ball and/or racket. In this context, potential energy return (PER) is equal to COR squared (COR2 or e2) as shown in Equation 4.

where e can be er, eb, or ec.
COR is thus used to calculate both energies and velocities. Viewing COR in the energy context, if COR = 0.6, then potential energy return is (0.6)2 = 0.36, or 36%. Likewise, viewing COR in the velocity context, if COR is 0.6 and the racket is clamped, then the perpendicular rebound speed will be 0.6 of the perpendicular incident speed (or, vy2 = -e(vy1)). We will use COR in both contexts below in order to trace the flow of energy and velocity between racket and ball throughout the collision in order to determine what factors are most important in maximizing racket power.
1.4. Apparent Coefficient of Restitution (ACOR)
The associated property to COR is ACOR (apparent coefficient of restitution, eA, or, in sports vernacular,"power potential"). ACOR is derived from and dependent on COR, but is simpler to use. ACOR measures the bounce speed off a stationary, free-standing racket. It is given as

Or, rearranged,
where eA is ACOR, and vy2 and vy1 are the speed of the ball perpendicular to the racket after and before contact. ACOR also has values between 0 and 1.0. Equation 5b says that the bounce speed from a stationary racket will be a ratio (eA) of the incident speed.
In the case of a moving incident racket, the bounce will occur from a moving object so the final ball speed (vy2) will be the bounce speed (ACOR times combined ball-racket incident speed) plus racket speed.
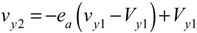
where (vy1 - Vy1) is the combined impact velocity of the ball and racket and Vy1 is the incident racket velocity. Equation 6 says that the final ball velocity will be the sum of a bounce (the elastic part of the rebound, -eA( vy1 - Vy1)), and a push (the speed of the racket from which the bounce takes off, Vy1).
ACOR is less than COR for unclamped rackets because it only accounts for the speed of one of the two objects in the collision. When both the racket and ball are unconstrained and free to move (recoil, rotate, and twist), then the resulting change in speed of each depends on their relative masses and the distribution of mass in the racket — the hittingweight (i.e., effective mass, Me). ACOR can be derived if COR and hittingweight are both known by the formula
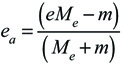
where Me is the hittingweight, m the mass of the ball, e is COR of a racket and ball collision, and eA is ACOR.
When testing rackets to compare velocities, ACOR is the go-to property. It has been designated as the "power potential" property of a racket. It is easier to measure than COR and is conceptually more flexible. To determine it experimentally, the only measurements necessary are the incident and rebound velocities of the ball. Racket velocity is not needed. However, COR must be used to trace the energy flow throughout the collision in order to determine the variables that influence the power potential and ways to maximize it.
1.5. Ball COR
Ball COR is given in the padel equipment rules. The rules state that a ball dropped from 2.54 m (100 in) onto a hard surface must bounce between 135 cm and 145 cm (53-57 in). Bounce height divided by drop height equals energy return. So, 135 / 254 = 0.53 and 145 / 254 = 0.57. COR is the square root of energy return, so COR must therefore be between √0.53 = 0.728 and √0.57 = 0.76. The average is 0.74. The ball stiffness was 17.3 N/mm (99 lbf/in). We will use those numbers in our calculations below.
1.6. Velocity Ratio
Velocity of and by itself is not a structural property of the racket, but its influence is so strong that even small changes can drown out the influence of differences between racket structures. The velocity ratio is given as V1 / v1. If the racket speed is greater than the ball speed, the ratio will be greater than 1, and if it is less than incident ball speed, it will be less than 1. In all the calculations that follow, the velocity ratio is controlled for by holding it constant while other variables change, or by changing it while other variables are held constant. In that way we can identify the influence of structural racket properties on rebound ball speed and not get them confused with the influence of incident velocities.
2. Experiment
Fifty rackets were tested using the experimental setup shown in Figure 1. The racket is secured at the tip, throat, and butt, and a 1.18 kg mass is dropped from 20 cm above the racket to impact close to the center of the racket head and in line with the widest part of the head. The force gauge records force throughout the impact and the LVDT measures change in position of the impact head throughout the drop, impact, and rebound. Both instruments record time. Using these measurements, calculations can be made for incident and rebound speeds, deformation and bending distance, potential and kinetic energies, impact duration, effective mass, stiffness, and COR and ACOR.
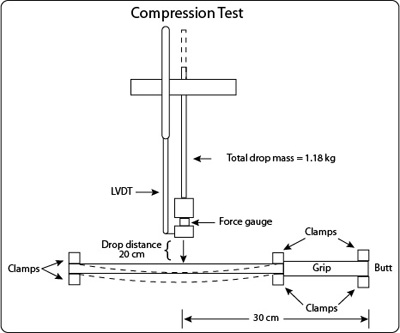
Figure 1 — Test device to measure racket bending, compression, stiffness, impact duration, and rebound speed. Test is preformed near the middle of the racket head, about 30 cm from the butt.
2.1. Test requirement: direct all impact energy into the racket
To ensure that all the kinetic impact energy is transformed into elastic potential energy in the deformed racket, two procedures are necessary: the racket is clamped to prevent energy loss in motion, and the impact head is much stiffer than the racket. As a result, virtually all the energy is directed into the racket and the resulting energy return is a consequence of the material properties of the racket alone.
3. Results
3.1. Clamped Racket Results
To determine the racket COR and stiffness, the impact head is dropped on the racket and incident and rebound velocities are recorded, as well as force and deformation. Figure 2 shows no dependent relationship between COR and material and structural stiffness for a collision between a clamped racket and super-stiff impact head. Not only is there no correlation, but there is also little difference between the CORs of any rackets, no matter the stiffness (average e = 0.66).
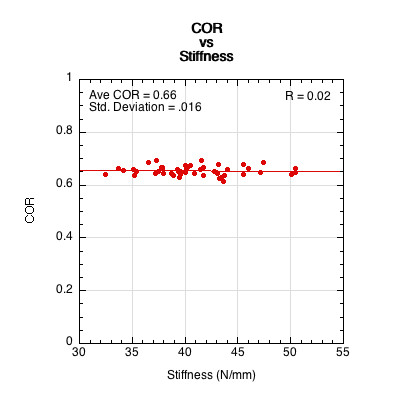
Figure 2 — When the clamped racket is hit with a super-stiff impact head, 100% of the energy is transformed into elastic potential energy in the deformed racket. The energy returned in the rebound is thus entirely due to the elastic properties of the racket since mass is effectively the same ("infinite") for all clamped rackets. That energy return ratio is COR2 (or, er2). There is no correlation between stiffness and COR for impacts near the center of a clamped racket.
Knowing the individual CORs of the racket (er) and ball (eb) when 100% of the impact energy is transformed into deformation energy in each separately, we next examine the energy flow between them during an impact of a ball with a clamped racket. In that case the impact energy is shared in their respective deformations. The combined COR of two colliding objects (ec) will depend on their individual CORs. Impacting a ball on a clamped racket will allow us to determine the contribution of the racket's elastic structure to the ball's final rebound velocity, independent of the racket's mass and distribution.
3.2. Flow of Elastic Energy Between Clamped Racket and Ball
To trace the flow of energy during impact, we need to determine the amount of kinetic energy that is transformed into elastic potential energy (PE), where that energy is stored (racket or ball), and how much of it is returned by each. The amount transformed is easy — because the racket is clamped, 100% of the impact energy will be converted into elastic potential energy as a consequence of the combined deformation of the racket and ball. (We will discuss the more general unclamped racket scenario of how to determine the amount of energy transformed into potential energy in Section 4.1.)
The shares of that potential energy are divided between racket and ball in inverse proportion to their stiffnesses — the softer object will get a larger share of the elastic energy. The potential energy share of the racket (PESr) is equal to ball stiffness (kb) divided by the sum of racket and ball stiffness (Eq. 8a), and potential energy share of the ball (PESb) equals racket stiffness (kr) divided the sum of racket and ball stiffness (Eq. 8b).
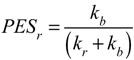
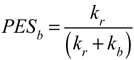
Figure 3 displays the distribution of elastic energy between the ball and racket for 50 rackets with individually measured stiffnesses and a universal ball stiffness of 17.3 N / mm.
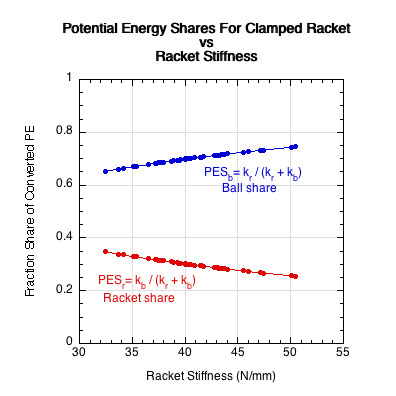
Figure 3 — For a clamped racket, 100% of the impact kinetic energy is transformed into elastic potential energy. The racket and ball share that energy in inverse proportion to their stiffnesses (ball stiffness equal to 17.3 N/mm for all calculations). As racket stiffness increases along the x-axis, the racket receives less elastic energy and the ball more. Because the racket is typically 2-3 times as stiff as the ball, up to 3 times as much potential energy is stored in the ball compared to the racket.
A fraction of the potential energy stored by each will be returned. That fraction is equal to the e2 of each. This is shown in Figure 4.
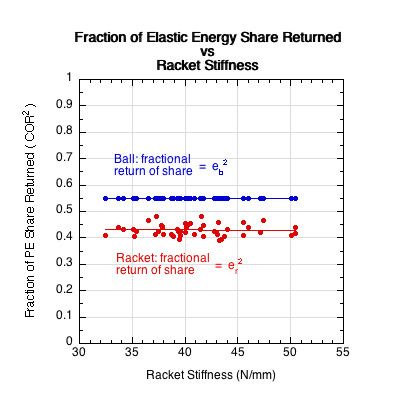
Figure 4 — The fraction of the stored potential energy that will be separately returned by the racket (er) and ball (eb). Not only does the ball store more energy than the racket, it also returns a larger fraction of that share (55%) than the racket (45%).
And last, Figure 5 shows the ratio of potential energy returned by both the clamped racket (PERr) and the ball (PERb). These values are calculated by multiplying the energy return ratio (shown in Figure 4) with the elastic energy share (shown in Figure 3) — PERr = PESr x er2 and PERb = PESb x eb2. Figure 5 also shows the combined energy return (PERc) (sum of individual racket and ball returns) and the combined COR (ec), which is the square root of the combined energy return (PERc1/2).
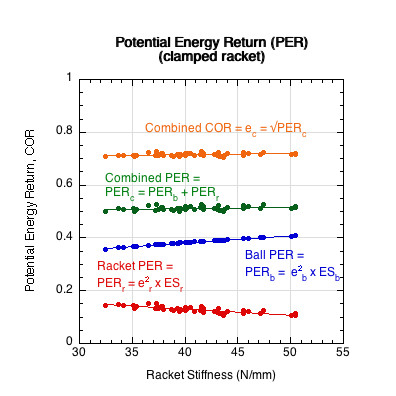
Figure 5 —For a clamped racket, the total fraction of elastic potential energy returned by both the clamped racket (PERr) and the ball (PERb) is calculated by multiplying the fraction of elastic energy returned (as shown in Figure 4) with the fraction of impact energy stored (as shown in Figure 3), which is then displayed in Figure 5. The sum of these energies represents the total fraction of elastic energy returned. Interestingly, this combined result (PERc) is approximately the same for every racket, as any loss or gain in energy share and/or return by the racket is neutralized by an opposing gain or loss in the ball's share or return.
Figure 5 illustrates that the range of the racket's elastic energy return (PERr) only varies between about 10-15% of impact kinetic energy. Therefore, we see that material properties alone account for only a 5% variance in energy return between rackets when impacted with a less stiff object like a ball. This 5% difference in performance is the result of the elastic properties designed into a racket. However, this small difference from one racket to the next does not translate to 5% percent difference between racquets in combined energy return of the racket and ball together. All gains and losses in the energy return due to racket stiffness are compensated by a comparable loss or gain in the ball. As a result, the final combined elastic energy returned is approximately the same for all clamped rackets, regardless of their design — about 52%, with 20-30% of that 52% contributed by the racket, for a net racket energy return (PERr) of about 10-15%.
4. Unclamped Collisions: Calculations, Discussion, Analysis
The data obtained in the clamped racket results allow us to predict what will happen for unclamped (free-standing) collisions in which either one or both objects are moving at impact.
4.1. Calculating Energy Flow For Free-Standing Collisions
The main difference between the elastic energy flow during a free-standing collision compared to a clamped-racket collision is the percentage of impact kinetic energy that is transformed into elastic energy. Whereas all the impact energy is converted to elastic energy for a clamped-racket collision, the amount and percentage of energy transformed in a free-standing collision will vary depending on the mass and velocity ratios of the racket and ball.
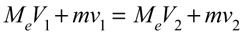
The law of conservation of momentum is the starting point for analysis of free body collisions. The law states that in a collision of two objects, the momentum after the collision will equal that before. This occurs by way of each object trading an equal but opposite amount of momentum to the other. Momentum is defined as mass times velocity. For a ball colliding with a racket,
With a little algebra, we see that
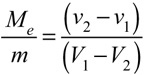
Equation 9b says that the change in the velocity of the ball compared to that of the racket is equal to the inverse ratio of the masses. This can also be written as

∆ ("delta") is the symbol for "change in."
Equations 9a, b, c make it look like ball velocity depends only on mass? What about all the other features built into a racket, like materials, stiffness, elastic energy return? To answer this question, we will have to trace the flow of energy (and velocity and momentum) for a free-standing racket, just as we did for the clamped racket.
To start, an overview: there are two phases to the collision — deformation and restitution. During the deformation phase, the ball and racket exert a mutual but oppositely directed compressive force against each other. This decreases the kinetic energy and momentum of each by changing their velocities. These velocities change in inverse proportion to their masses. The decrease in kinetic energy is partially compensated by the conversion of that energy into elastic potential energy. The amount of energy stored depends on the amount of deformation of each — greater distance of deformation yields greater potential energy — and the amount lost to heat due to the internal friction caused during deformation. At the point of maximum deformation, potential energy conversion is complete and the ball and racket are stuck together travelling at the same speed — we'll call that the squished velocity (Vsquished). In other words, their relative velocity to each other is zero, even though relative to the lab or the court their velocity is Vsquished. Here begins the restitution phase.
In the restitution phase, the stored potential deformation energy in each is used to push off against each other until they are no longer in contact. The ball, being lighter and having greater deformation, pushes off with more energy and greater acceleration than the racket. At the moment of separation, their velocity relative to each other is the separation velocity. Their individual velocities are measured relative to their "zero" velocity (Vsquished) at the end of the deformation phase. As in the deformation phase, during each instant of the restitution phase, the velocity of each is being changed in inverse proportion to its mass.
There is a lot going on here, and if we want to be able to identify input variables we can alter to maximize racket power, we need a strategy and method of calculating and analyzing this flow of energy. This strategy is as follows.
First we determine the kinetic energy before (KE1) and after (KE2) impact, as shown in Equations 10a and 10b.
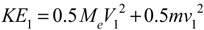
where KE1 and KE2 are the combined ball and racket kinetic energies before and after impact, subscripts 1 and 2 indicate before and after impact for all parameters, and upper case symbols are the racket and lower case the ball.
If we subtract KE2 (energy after) from KE1 (energy before), we get the total energy lost during impact.
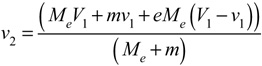
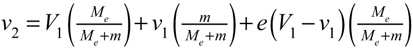
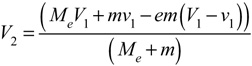
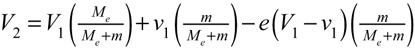
But we have two problems: (1) we don't know the post-impact velocities in Eqs. 9a-11, and (2) knowing the potential energy lost (Eq. 11) still doesn't tell us how much was initially converted and stored from which the loss was deducted. To solve the first problem, we have to define the unknown post-impact velocities in Eq. 10b in terms only of known incident parameters and the experimentally obtained coefficient of restitution. It can be shown [1] that v2 and V2 can be defined in terms of incident parameters with Equations 12 and 13. These have also been rearranged as Equations 12b and 13b in order to separate the deformation from restitution portions of the energy exchange as well as to highlight the role of the mass ratios in determining the flow of energy.
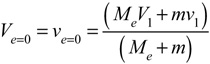
We now have incident parameter equations that we can substitute into Eq. 10b, but we can simplify further. If we assume the coefficient of restitution, e, equals zero in Eqs. 12 and 13, meaning that potential energy is stored but that none of that is returned, then the ball will not bounce from the racket, and they will be stuck together travelling at the same speed. (Note: If e actually were 0, that would be the end of the impact. However, even when e does not equal 0, during every impact there is a moment when ball and racket have the same velocity and have achieved maximum deformation — previously referred to as Vsquished. Then the ball and racket bounce off each other using the returned elastic potential energy.)
Using the e=0 trick, we have determined how much kinetic energy is converted to potential energy. We know that when e = 0, the total energy lost is the total energy converted to potential energy. So, if e = 0, then Eqs. 12 and 13 both reduce to
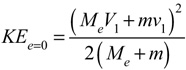
Because the third terms in Eqs. 11-12 disappear when e = 0, KE2 is equal to KEe=0. Substituting KEe=0, Ve=0, and ve=0 into Eq. 10b, when e = 0, it can be shown that the kinetic energy (KEe=0) is
And KE1 - KEe=0 becomes
Equation 16 then solves to

Where KEr1 is the incident racket kinetic energy ( KEr1 = 0.5MeV2), and KEb1 is the incident ball energy (KEb1 = 0.5mv2), and the denominator is shown to be divided over each term in order to highlight the role of mass ratios. When e = 0, PE (potential energy) is the quantity of energy converted to potential energy as well as the quantity of energy lost. Equation 17 explicitly demonstrates that the amount of kinetic energy converted into potential energy is determined by the mass ratios, as well as the incident velocities.
The fraction of impact energy converted to potential elastic energy (PEf) is then

where subscript f stands for "fraction."
Having calculated energy converted to potential energy (PE), we now have all the elements to trace energy flow throughout the impact. Recalling that Eqs. 8a and 8b determine the potential energy share of the racket (PESr) and of the ball (PESb), and further that the return of energy is determined by e2 (Eq. 4) of the racket and ball, we see that the potential energy return values of the racket (PERr) and ball (PERb)are
Total potential energy returned (PERt) is the sum of Eq. 19 and 20.
Upon return, the total potential energy is converted back to kinetic energy and distributed between the racket (KEe,r) and ball (KEe,b) in inverse proportion to their mass ratios, where the KE subscript e is for "elastic". The results are displayed in Equation 22 and 23.
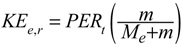
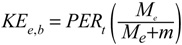
These are the kinetic energies due only to the restitution phase. The restitution velocities will then be
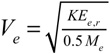
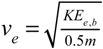
where the velocity subscript e is for "elastic", meaning the contribution to final velocity of the restitution phase only — i.e., the result of the third terms in Eqs. 13b and 12b respectively. They are the elastic contribution to final velocity. The first two terms in these equations combine to be deformation phase contribution to final velocity. The sum of all three terms is the final racket and ball velocities. We now have the equations to calculate hypothetical outcomes and to determine what properties of the racket and ball are most important in delivering final shot speed.
5. Numerical Solutions To Predict, Alter, And Optimize Energy Return Outcomes
In Section 3 we measured, analyzed, and compared the performance of 50 rackets. Section 4 developed the calculations necessary to predict, design, and optimize the outcome of a ball-racket collision. In this section we will use those calculations to predict and analyze outcomes by varying the inputs responsible for racket power. For this analysis, we begin with given input parameters and then use the above equations to numerically solve for output parameters. The given input parameters are typical average values for padel impacts obtained from the 50 rackets tested in Section 2. The starting inputs are Me / m = 5 (mass ratio with default Me = 0.290 kg and m = 0.058 kg), V1 / v1 = 1 (velocity ratio with default V1 = 5 m/s and v1 = -5 m/s.), kr / kb = 2 (stiffness ratio), PERr = 0.45 (energy return of racket). The ball energy return is set at 0.55. In the following graphs, the potential energy return is given as a fraction (PER%) and as an amount in Joules (PER J). For each calculation, one input ratio is varied while all others are held constant.
Figures 6-9 show the changes in output variables for changes in a single input variable. Figure 6 shows that as the mass ratio increases, the impact kinetic energy (KE1) increases. However, the fraction of this increased energy that is converted into potential elastic energy (PE%) decreases. And yet, as calculated by Eq. 17, even as the percentage of PE decreases, the absolute amount increases (PE J). Every percent increase in mass increases the amount of converted energy, but in decreasing amounts (i.e., by progressively smaller percentages). The combination of increased kinetic energy and a corresponding increase in PE conversion and return (PER J) results in greater ball velocity.
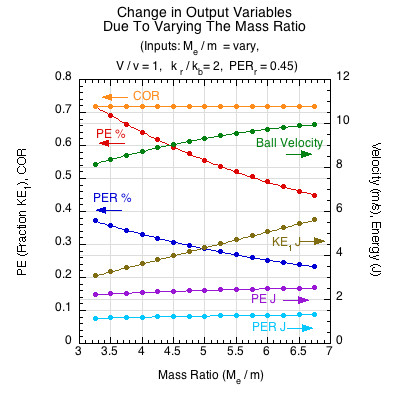
Figure 6 — Impact kinetic energy (KE1) increases with increasing mass ratio (all else remaining equal). More energy is therefore converted to potential energy (PE J), but in decreasing percentages (PE %). Equation 17 is a hyperbolic function and approaches an asymptotic maximum as the mass ratio continues to increase. Therefore each percentage increase in mass ratio results in decreasing percentage increases in PE. However, the combination of increased kinetic energy and a corresponding increase in PE conversion and return results in greater ball velocity.
Figure 7 shows the results of varying the energy return of the racket (PERr). Varying the energy return does not effect the impact kinetic energy or the energy converted to potential energy (PE% and PE J), but causes all other parameters to increase (COR, rebound velocity, PER%, PER J) as it increases. Just as in the clamped racket cases, the total potential energy will be divided between the ball and racket based on their relative stiffness (kr/ (kr + kb) and kb / (kr + kb)), and each object's share is returned proportionate to its energy return value (CORr2 and CORb2). The sum of each object's energy return is the combined potential energy return in joules (PER J) or as a fraction (PER %). The x-axis varies only the racket energy return, since the ball energy return is essentially fixed by the rules at 0.55. This is shown in Figure 7.
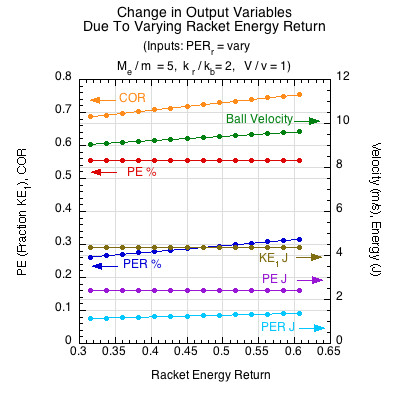
Figure 7 — Increasing the energy return does not effect the impact kinetic energy or the energy converted to potential energy (PE% and PE J), but causes all other parameters to increase (COR, velocity, PER%, PER J).
Figure 8 shows the resulting increase in rebounding ball velocity due to increasing the stiffness ratio on the x-axis (kr / kb)). The resulting changes in the output variables are much more subtle in this case. The amount of KE converted to PE is constant, but more of the PE is directed into the softer object, the ball, which also has a greater energy return than the racket (55% to 45%). Therefore, more energy into the more efficient object results in greater COR, PER%, PER J, and velocity, slight as they may be.
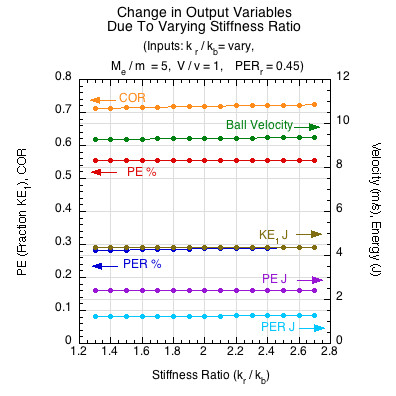
Figure 8 — Varying the stiffness ratio changes the shares of potential energy between the ball and racket. The ball is both softer and more energy efficient than the racket. Thus when the stiffness ratio increases, it gets a larger share of the PE and thus returns more, resulting in slightly greater COR, PER J, PER%, and velocity. The opposite occurs for decreases in the stiffness ratio.
Figure 9 shows that increasing the incident velocity ratio (vr / vb) results in a greater increase in ball velocity than any other input parameter. It results in large changes in incident KE, providing more energy to divy up and return. This results in greater energy conversion to PE (PE J) and greater return (PER J) of that converted energy, even though the percentages of each decreases (PE% and PER%).
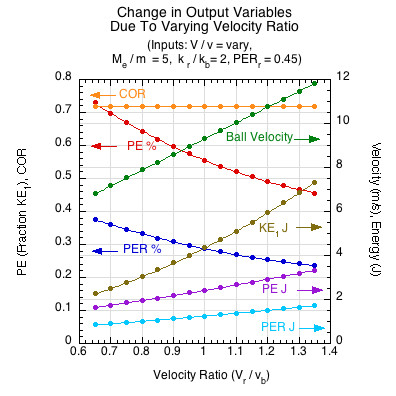
Figure 9 — Even though increasing the incident velocity ratio increases ball velocity more than any other input, it is not a structural property of the racket. It is presented only to show the relative contributions of input parameters to ball speed and to highlight the importance of "external" to internal factors in power.
In order to scale and normalize the ball speed results of Figures 6-9, Figure 10 shows percent changes in ball velocity (y-axis) arising from percent changes in each of the input values (mass ratio, stiffness ratio, racket energy return, velocity ratio) on the x-axis. Each curve fit is the percentage change in ball velocity due to the percentage change in the specified input (the curve label). For example, a 10% change along the x-axis in the mass ratio (red mass curve) results in about a 3% change in ball velocity on the y-axis, and a 30% change on the x-axis would result in about a 6% increase on the y-axis.
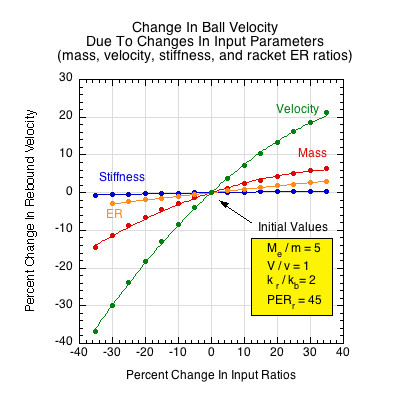
Figure 10 — Change in ball velocity due to changing input parameters. Each curve fit is the percentage change in ball velocity due to the percentage change in the specified input, as indicated by the curve label.The incident velocity ratio has the greatest influence on outgoing ball velocity, but that is not a feature built into the rackets. Except for the influence of swingweight on racket speed, the velocity ratio is an "external" factor, especially with respect to incident ball velocity. Altering the design, materials, and construction of the racket only contribute modest changes to ball velocity. Of these, the mass ratio is most influential, followed by the racket's energy return and then it's stiffness.
Similar to Fig. 10, Figure 11 shows percent changes in KE conversion to PE arising from percent changes in each of the input ratios or values.
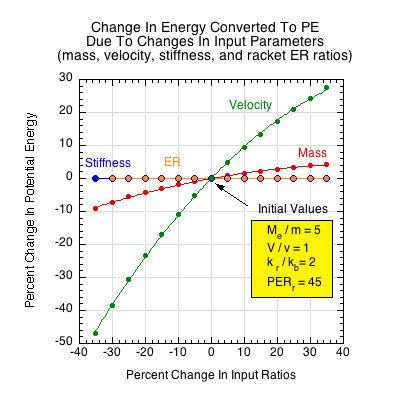
Figure 11 — Energy conversion due to varying input parameters. Each curve fit shows percent changes in PE conversion arising from percent changes in each of the input ratios or values. Mass and velocity ratios determine how much energy will be converted to PE. Stiffness and ER do not influence the amount converted but do determine how that amount will be divided and returned.
Varying the input variables alters the amount of energy that is available and the amount converted to PE. All else being equal, more energy on the front end will always result in greater PE conversion, PE return, and ball velocity. But, in the end, whatever additional energy is returned, it becomes manifest as velocity according to the inverse of the ratio of masses as dictated by the conservation law in Eq. 8c. So, if 2 percent extra PE is returned due to altering input ratios, then, if the mass ratio is 5, then the 2 percent increased energy return will be divided such that 0.333 percent (0.1667 x 2) will go to changing racket speed and 1.667 percent (0.833 x 2) will go to changing ball speed.
The question naturally arises, "what is the maximum possible velocity due to changing racket properties?". For this analysis, the stiffness ratio is 1 and the mass ratio is 5. The velocity ratio (V1 / v1) was varied along the x-axis in two ways: (1) by setting denominator v1 to 1 and varying V1 in integer increments greater than 1, and (2) setting the numerator V1 to 1 and varying denominator v1 by the same integer values, making reciprocal fractions to the numerator's changes (Figure 12). A velocity ratio of 4 means the incident racket speed is 4 times that of the ball. If the velocity ratio is 1/4, the racket speed is one fourth that of the ball — i.e., the ball speed is 4 times that of the racket. Final ball velocities were then compared for a normal racket energy return of 45% and for one of 100%. Figure 12 shows the result.
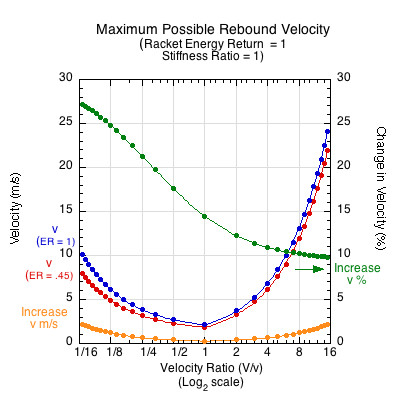
Figure 12 — Maximum possible shot speed. Parameters: stiffness ratio = 1, mass ratio = 5, ball energy return = 55%. Racket energy return equal to either 45% or 100%. The velocity ratio on x-axis was varied. If velocity ratio is greater than 1, the racket is swinging faster than incident ball. If velocity ratio is less than 1, the incident ball is faster than the incident racket.
4. Conclusion
Experiments were done to determine the relevant properties of the ball and racket to power production (final ball velocity). These were preformed with a clamped racket and a stiff impact mass. This technique assured that the results were the consequence of only the racket's properties. Equations were then derived to implement the analysis. The experimental quantities were plugged into the equations to find final ball velocities. The effect of altering each property while holding all others constant was analyzed to determine the relative contributions of all variables to ball velocity.
Ball speed is a function of several variables: racket and ball coefficients of restitution (or energy return), stiffness ratio between racket and ball, effective mass ratio of racket to ball, and velocity ratio of racket to ball. The order of consequence to final ball velocity is velocity ratio, mass ratio, energy return ratio, stiffness ratio. Increasing swing speed (velocity ratio) increases ball velocity more than anything else, but velocity is an external variable, not a built-in property of a racket. It was shown that the effective mass ratio is involved in every phase of the collision. First it determines the amount of energy converted to potential energy. Then the stiffness ratio determines the share of potential to be divided between ball and racket, whereupon the energy return ratio of each (COR2) determines how much of each's potential energy share is returned. Mass ratio again takes over to determine the distribution of the total returned potential energy between racket and ball.
Although altering each of the input parmeters does influence ball velocity, it is not by a great deal (Figure 10). For example, if effective mass ratio is increased by 20%, the ball velocity increases about 4%. Increase energy return by 20% and ball velocity increases about 2%. Increasing stiffness ratio by 20% increases speed by about 0.3%. Increasing the velocity ratio 20% results in about 14% more ball speed.
Twenty percent increase in any input parameter is a very large and unrealistic increase to achieve, and even if successful, the reward is marginal. Most rackets fall within about a 5-7% range of power potential (ACOR) difference between rackets from lowest to highest. Current technologies can customize a racket within that range, but to go outside the range is either difficult or unwanted. Obviously, no one wants a severely underpowered racket. And even when power can be increased, it may have unwanted consequences. More mass gives more inherent racket power but may result in lower shot speed if the player loses too much swing speed. A stiffer racket may marginally increase power, but it may cause unwanted shock. And increasing COR may result in losing control. Consequently, the industry has settled in the 5-7% low-to-high difference range for now.
When most players think about increasing power, they think about increasing its elastic properties of energy return by using different materials, or by altering stiffness, resiliency, thickness, or geometry. But even if energy return of the racket is increased to 100%, the increase in ball speed tops out at about 10% for a normal stroke with the swing speed faster than the incident ball speed, as shown in Figure 12.
Given such a relatively small range of possibility for differences in power between rackets, it begs the question of whether a player can actually objectively perceive the differences. There is no doubt that a player can feel all sorts of differences between rackets, but the interpretation and explanation of those differences may or may not be congruent with actual measurements. On the other hand, if a player likes a racket, no matter the real or imagined attributions given to that racket, he/she will play with more confidence and consequently swing faster and more accurately. In the end, the player may indeed get more, even a lot more, ball speed from a racket even if it is underpowered by actual measurement. Every racket property combines with all others to produce a "feel". Whatever that is, if a player knows the values of all the quantitative property measurements for that racket, then rackets with similar numbers will probably feel the same and play the same.
5. References
[1] H. Brody, R. Cross, C. Lindsey, "The Physics and Technology of Tennis," Racquet Tech Publishing, p.120, 2002.