ABSTRACT
This study measures the drag (CD) and lift (CL) coefficients of indoor (26-hole) and outdoor (40-hole) pickleballs in free flight. Using high-speed video and trajectory-fitting simulations, effective aerodynamic coefficients were derived from 86 experimental trajectories across a range of spin rates and launch conditions.
Three persistent and unexpected anomalies emerged from the data: (1) a marked asymmetry between topspin and backspin lift coefficients (CL), with topspin showing stronger dependence on spin number (S); (2) substantial lift (positive and negative CL) even at very low or zero spin; and (3) a surprisingly weak correlation between CL and S for backspin, compared to topspin.
To explain these findings, we hypothesize that gravity modifies boundary-layer airflow — accelerating air descending around the ball and decelerating air ascending. This subtle effect introduces a consistent bias in separation behavior between the top and bottom of the ball, regardless of spin. It explains all three observed anomalies: (1) the baseline downward lift at zero spin, (2) the amplification of topspin lift relative to spin rate, and (3) the flattening of backspin lift dependence on spin.
Such gravity-induced aerodynamic asymmetries are rarely discussed in wind tunnel studies, likely because wind tunnels eliminate the gravitational conditions present in free flight. Although the forces are small, their effect on separation timing and wake direction may be multiplicative, producing measurable flight differences in free trajectories.
1. INTRODUCTION
Pickleball paddles are engineered to enhance spin, and paddle regulations attempt to control that capability. While much is known about how paddles generate spin, the real-world consequences of spin — its effect on ball flight — are less well understood. This study analyzes drag and lift during free-flight trajectories to better model and predict ball behavior during play.
The standard assumption in ball flight research is that the airflow around a back-spinning ball mirrors that of a top-spinning ball — equal in magnitude, opposite in direction. The upward lift from backspin should perfectly counter the downward dip from topspin. Surprisingly, our experiment revealed otherwise. This unexpected result became the central focus of the study, ultimately leading to an equally surprising conclusion: gravity creates an inherent asymmetry in the airflow between topspin and backspin. Accordingly, the study puts forth a revised model to account for this asymmetry.
1.1 Key Aerodynamic Parameters
Two dimensionless coefficients describe ball-air interactions:
- Drag coefficient (CD): Resists forward motion.
- Lift coefficient (CL): Causes trajectory deflection (dip or rise due to spin).
The forces they govern are:
(1) FD = 0.5 CD ρ A v2
(2) FL = 0.5 CL ρ A v2
Where: FD = drag force, FL = lift force, ρ = air density (1.21 kg/m3), A = ball cross-sectional area, v = speed relative to air, m = ball mass. The common factor 0.5ρAv2 represents dynamic pressure.
Drag always opposes motion and increases with speed. Lift depends on spin: topspin causes downward force (upward wake deflection), while backspin causes upward force (downward wake deflection).
1.2 Flow Regimes and the Role of Reynolds Number
Ball–air interactions change depending on flow regime, governed by Reynolds number (Re):
(3) Re = vD/μ
Where: D = ball diameter, v = velocity, μ = kinematic viscosity of air at 20ºC (μ ≈ 1.5 × 10⁻⁵ m2/s).
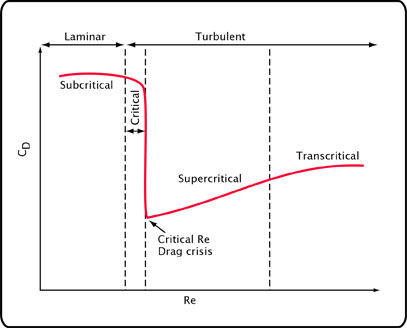
Figure 2: Air flow regimes.
Figures 3–5 illustrate laminar, turbulent, and spinning airflow patterns and their effects on wake formation and force generation:
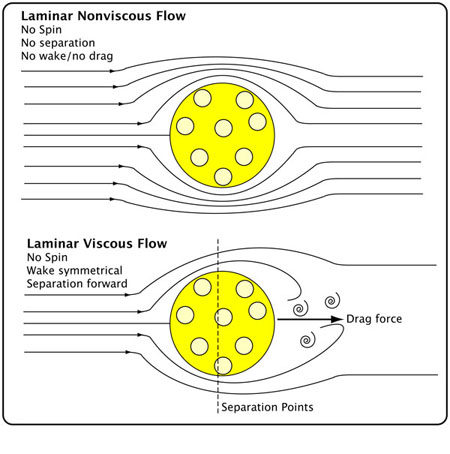
Figure 3: Laminar flow. Idealized, non-viscous flow; not observed in real-world conditions.
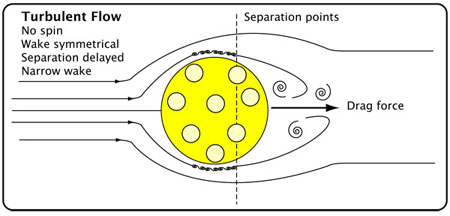
Figure 4: Turbulent flow without spin. Turbulent flow brings extra energy close to the surface, helping the air stick longer and delay separation from the ball.
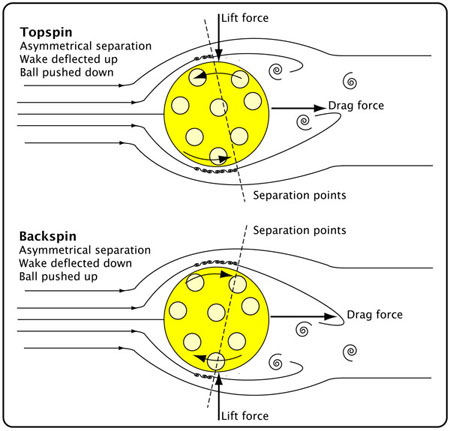
Figure 5: Turbulent flow with spin (Magnus effect). On the side spinning against the airflow, the surface slows the air down even more, making it harder for the flow to stay attached and causing earlier separation.
2. PREVIOUS PICKLEBALL RESEARCH
Experimental studies on pickleball aerodynamics are scarce. Most prior research relies on computational models, with few direct free-flight or wind tunnel measurements.
Steyn et al. (2025) [1] conducted a free-flight study of six outdoor pickleball trajectories, estimating an average drag coefficient CD ≈ 0.30 ± 0.02, and a spin-dependent lift coefficient CL ≈ 0.195⋅S, where S is spin number. However, the sample size was small and limited to outdoor balls.
Creer (2023) [2] conducted CFD modeling but encountered significant numerical instability, limiting interpretability. Emond, Sun, and Swartz (2024) [3] simulated ball motion assuming a fixed CD = 0.6 but did not model lift.
Many researchers reference Rossmann and Rau (2007) [4], who measured wiffleball aerodynamics in a wind tunnel. They showed that vortex formation and lift direction depended strongly on hole orientation. However, pickleballs, with symmetrical hole distributions, behave differently.
To date, no study has systematically measured both drag and lift across spin rates for indoor and outdoor pickleballs during free flight. This work fills that gap and reveals new aerodynamic complexities not captured by previous models.
3. EXPERIMENT AND METHODS
3.1 Launch Setup and Measurement
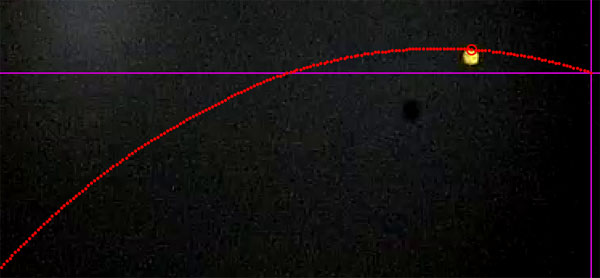
Balls were launched using a custom-built, bungee-powered pendulum device (Figure 6), allowing precise control over initial velocity, launch angle, and spin. Launch speeds ranged from 5 to 13 m/s (11–29 mph), covering a wide velocity range seen in gameplay.
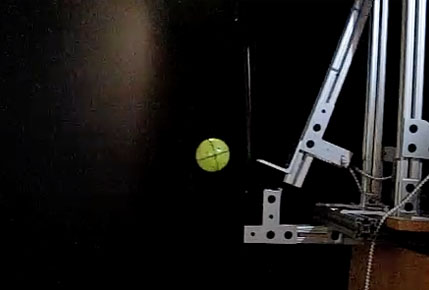
Figure 6: Pendulum launch device. Spin is adjusted by sliding the impact projection up or down to impact top or bottom of ball. Velocity is adjusted by raising the height of the pendulum arm and stretching the elastic Bungee cord.
Two synchronized high-speed cameras recorded each launch:
- Camera 1 (side view): Positioned ~1 meter perpendicular to the launch point to measure initial velocity (v0), launch angle (θ), and spin (ω).
- Camera 2 (downrange view): Placed several meters away to capture horizontal motion across approximately 5 meters of flight.
Videos were recorded at 300 frames per second, digitized using Tracker Motion Analysis Software, and exported as (t, x, y) coordinate data for trajectory analysis.
3.2 Trajectory Simulation and Optimization
A custom Python simulation program was developed to reverse-engineer aerodynamic forces. Starting from known initial conditions (v0, θ, ω), the program integrates the equations of motion using the Runge-Kutta 4th order method, simulating the ball’s path for trial values of CD and CL.
The program:
- Compares the simulated trajectory to the experimental data
- Iteratively adjusts CD and CL to minimize the sum of squared errors (SSE)
- Reports final values of drag and lift coefficients along with trajectory plots and fit quality metrics
Figures 7a and 7b show example outputs of the optimizer for both topspin and backspin trials using indoor and outdoor balls. A total of 86 free-flight trajectories were analyzed, yielding a mean endpoint error of 15 mm, indicating excellent fit quality.
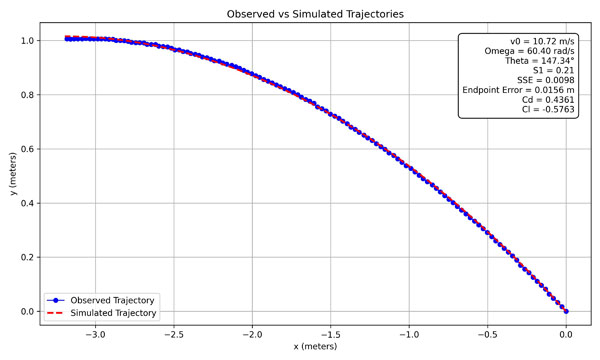
Figure 7a: Example simulation for large-hole ball with backspin.
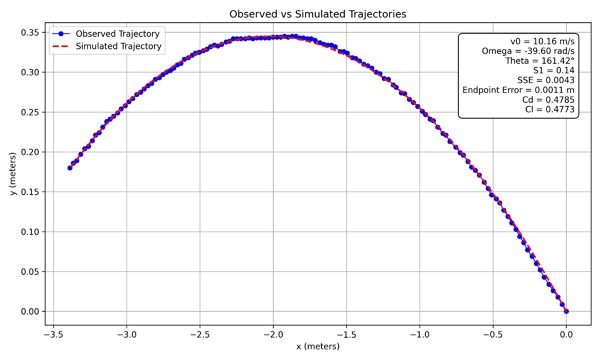
Figure 7b: Example simulation for small-hole ball with topspin.
To validate the extracted CD and CL values and ensure physical interpretability, several robustness checks were performed:
- Subsampling: Trajectory points were selectively sampled to verify consistency. Coefficients remained stable within statistical error margins.
- Penalty Functions: Modified SSE functions penalized unrealistic coefficients. No improvements in fit quality resulted.
- Constraint Tweaks: Bounds and solver parameters were varied to test for local minima trapping. All modifications worsened fits.
- Smoothing Variants: Smoothed vs. raw trajectory data comparisons showed minor jitter reduction but no meaningful changes to coefficient trends.
- Residual Analysis: SSE and endpoint error metrics were consistently monitored to ensure physically plausible solutions.
Across all tests, the final CD and CL values that minimized error most faithfully also produced the most physically plausible trajectories. Although ambiguity is inherent in inverse modeling, the consistency across trials argues against optimizer artifacts driving the results.
3.3 Sources of Variation and Noise
Despite the high precision of the fits, variability in calculated coefficients was observed even among nominally similar launches. Two principal causes were identified:
- Digitization Noise: Small inconsistencies in manual tracking — especially near trajectory apexes — could significantly influence aerodynamic parameter estimation.
- Flow Instability Due to Hole Geometry: The holes induce turbulent structures and localized instabilities, causing minor shot-to-shot variations in boundary layer behavior and wake development. This is physical variability, not random measurement noise.
3.4 Launch System Constraints and Variable Coupling
The pendulum launch system generated spin by striking the ball off-center. This inherently reduced translational velocity, as energy was divided between rotation and translation. Consequently, higher-spin trajectories tended to have lower initial velocities (v0) and therefore lower Reynolds numbers (Re). This created an unavoidable coupling between spin number (S) and Re.
Although attempts were made to partially decouple velocity and spin (e.g., adjusting pendulum height for higher-spin shots), full independence was not achievable with this setup. Thus, correlations between CL, CD, Re, and S must be interpreted with this constraint in mind. Nevertheless, relative differences between ball types and spin directions were robust across trials, supporting the validity of comparative conclusions. Future experiments may benefit from launch systems capable of independently controlling spin and velocity.
4. RESULTS AND ANALYSIS
4.1 Drag Force and Coefficient of Drag (CD)
Each of the 86 trajectories — covering a wide range of spin rates, velocities, and angles — produced closely matching simulated paths. Despite strong overall fit, notable variability in extracted drag coefficients (CD) was observed, even among similar initial conditions.
This variability is attributed to:
- Minor differences in digitized coordinates
- Inherent aerodynamic instability from hole-induced turbulence
4.1.1 Statistical Spread
Figure 8 shows the distribution of CD values for indoor (26-hole) and outdoor (40-hole) balls. Despite trial-to-trial scatter:
- The mean CD values for each ball type were stable
- The standard errors were small enough to inspire confidence:
- Indoor ball (large holes): Mean CD ≈ 0.45, SD = 0.092, SE = 0.013
- Outdoor ball (small holes): Mean CD ≈ 0.33, SD = 0.083, SE = 0.014
This suggests that while turbulence introduces variability, the overall aerodynamic behavior of each ball type is highly reproducible.
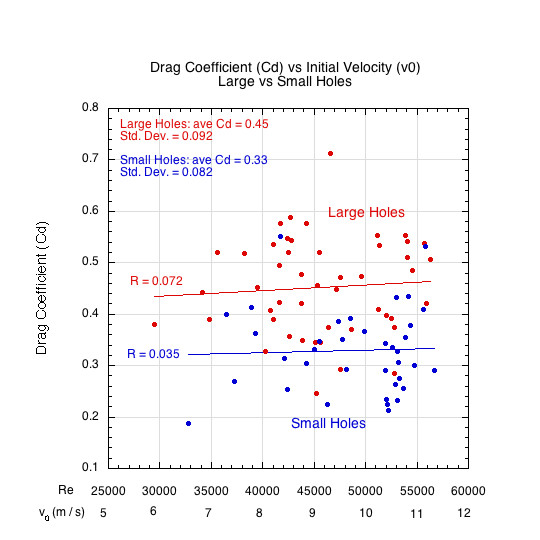
Figure 8: CD for large- and small-hole balls. Mean CD is relatively constant within each group.
The clear separation between large- and small-hole ball behavior — along with within-type variability — supports the hypothesis that hole-induced airflow variations are an intrinsic aerodynamic feature of free-flight pickleballs, not an artifact of modeling or measurement error.
4.1.2 CD and Hole Modifications
A supplementary prototype study was conducted to investigate the effect of internal airflow on drag. Three modified large-hole balls were tested:
- Balloon inserted and inflated inside the ball
- Tape covering each hole externally
- Non-modified control ball
Each ball was tested across 8–10 trajectories with varying spin rates, though over shorter flight paths due to facility limitations. While absolute CD values differed from full-length experiments, relative relationships between ball modifications remained consistent. Figure 9 summarizes the findings.
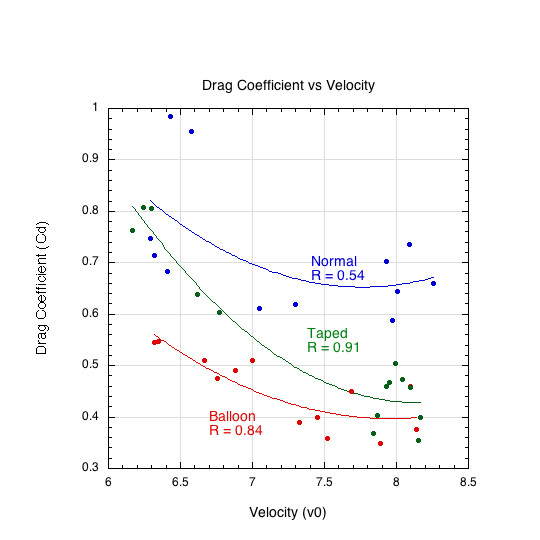
Figure 9: CD vs type of hole modification.
The taped ball, while eliminating internal airflow, introduced surface roughness that modestly increased drag. The balloon-inserted ball eliminated internal airflow without adding surface roughness. Both modifications substantially reduced drag variability compared to the control ball, supporting the idea that internal airflow contributes meaningfully to aerodynamic instability.
4.1.3 Regime Identification: Supercritical Flow
Figure 10 plots drag force against Reynolds number (Re), and Figure 11 shows the relationship between drag force and drag coefficient. Together with Figure 8, these confirm:
- Drag force increases with velocity (as expected)
- Drag coefficient remains relatively constant or increases slightly with velocity
This behavior is characteristic of the supercritical flow regime, in which:
- Flow is turbulent at all speeds
- There is no "drag crisis" (no sudden drop in CD)
- The turbulent boundary layer remains attached longer, but wake growth eventually causes CD to slowly rise again at higher velocities
Thus, for both ball types, flow is presumed fully turbulent across the entire experimental velocity range.
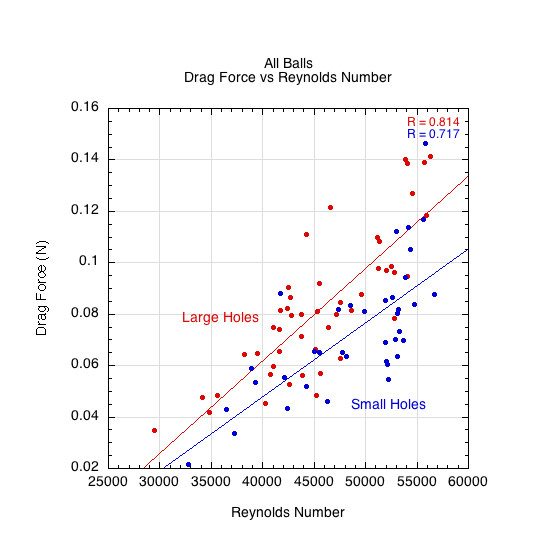
Figure 10: Dependence of drag force (FD) on Reynolds number (Re). Drag force increases as Reynolds number (velocity) increases.
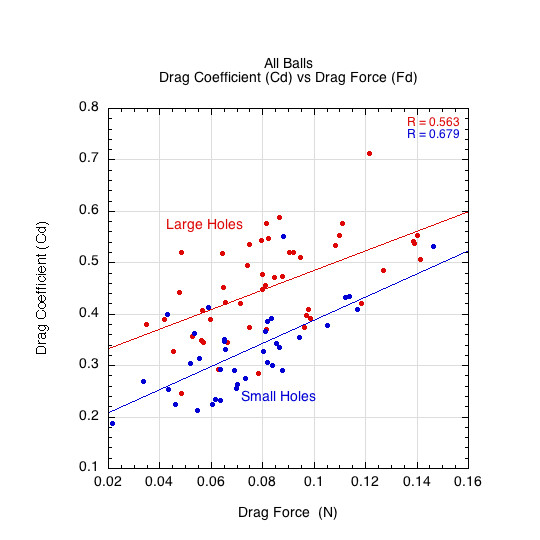
Figure 11: Dependence of drag coefficient (CD) on drag force (FD). CD remains stable or slightly rises with increasing drag force.
4.1.4 Understanding the Stability of CD
From Equation (1):
- FD = 0.5CDρAv2 ⇒ CD = FD / 0.5ρAv2
Thus, even though drag force FD rises with velocity, the mathematical structure of the equation ensures that the velocity dependence largely cancels out when solving for CD. This explains the observed relative constancy of CD across a broad velocity range as shown in Figure 8.
4.2 Lift Force and Coefficient of Lift (CL)
Lift behavior proved much more complex than drag. Although CL exhibited strong trial-to-trial variability, several consistent and surprising patterns emerged:
- A persistent lift asymmetry between topspin and backspin
- A weak or nonexistent dependence of backspin CL on spin number (S)
- Substantial lift observed even at near-zero spin
Each of these anomalies is discussed below.
4.2.2 Anomaly 1: Asymmetry Between Topspin and Backspin
Figure 12 shows that for equivalent spin magnitudes, topspin consistently produced larger lift forces than backspin. This breaks the expected mirror symmetry of classical Magnus forces, where reversing spin direction should simply reverse lift direction — not lift magnitude.
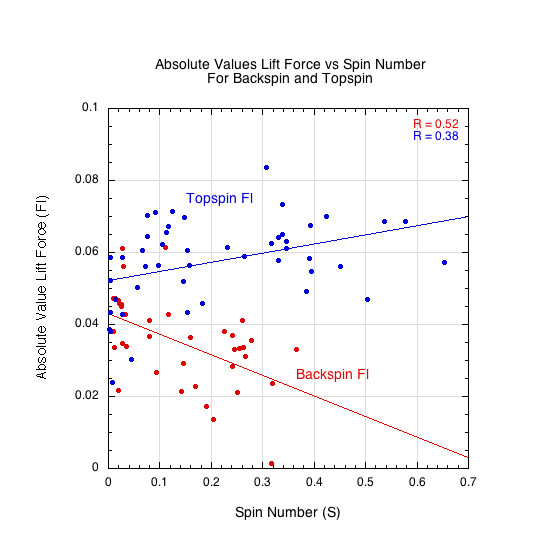
Figure 12: Absolute value of lift force (FL) vs. spin number (S) for topspin and backspin. Topspin produces systematically stronger lift.
4.2.3 Anomaly 2: Backspin’s Non-Dependence of CL on Spin Number
Figure 13 plots the absolute value of CL against spin number (S = Rω / v0) and highlights a second asymmetry: whereas topspin cases show a strong, linear dependence of lift coefficient on spin, backspin cases cluster around a low, nearly flat baseline (CL ≈ 0.2).
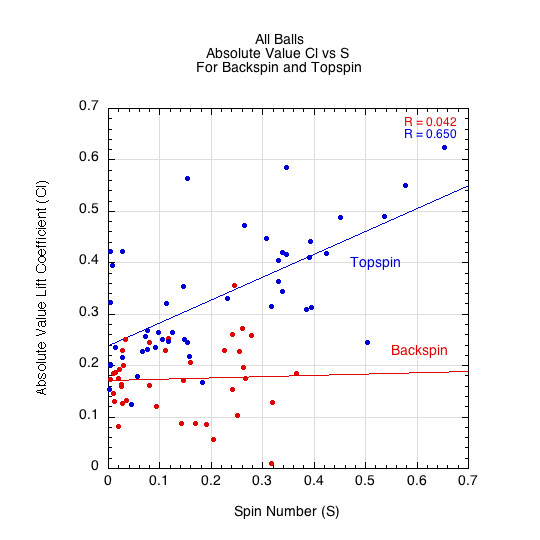
Figure 13: Absolute value of CL vs. spin number (S). Topspin lift rises strongly with spin, while backspin lift shows little dependence on S.
4.2.4 Anomaly 3: Nonzero Lift at Near-Zero Spin
Figure 14 illustrates that even at very low spin rates (near ω ≈ 0), balls exhibited measurable lift forces — both positive and negative. This contradicts classical Magnus theory, which predicts zero lift at zero spin. The presence of significant lift at S ≈ 0 suggests that other forces — such as gravity-induced flow asymmetry or hole-driven instabilities — contribute materially to lift generation.
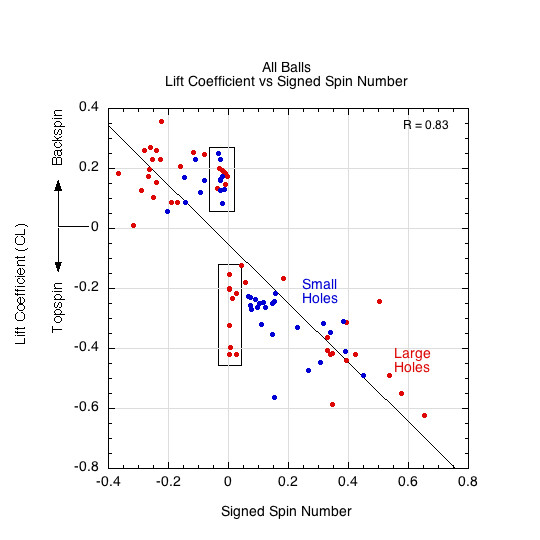
Figure 14: Lift coefficient (CL) vs. signed spin number (S). Significant lift is observed even at very low spin, suggesting non-Magnus contributions.
These three anomalies — lift asymmetry, weak backspin dependence, and nonzero lift at low spin — form the motivation for a revised aerodynamic model, outlined in the following sections.
5. DISCUSSION: TOWARD A REVISED MODEL OF PICKLEBALL AERODYNAMICS
The results of this study challenge the standard aerodynamic model of ball flight. Classical Magnus theory predicts that topspin and backspin of equal magnitude should generate equal and opposite lift forces. However, free-flight trajectory data for both indoor and outdoor pickleballs consistently reveal three persistent anomalies:
- Higher-magnitude lift coefficients for topspin than for backspin
- Significant lift even at near-zero spin
- A persistent downward lift force across all trajectories
These results suggest that standard spin-based models are incomplete. To explain these patterns, we propose a revised aerodynamic model that integrates three overlapping mechanisms: traditional Magnus lift, gravity-induced flow asymmetry, and internal airflow effects caused by the perforated structure.
5.1 A Three-Component Lift Model
We propose that the total measured lift coefficient (CLmeasured) is composed of three superimposed contributions:
- CLmeasured = CLMagnus + CLgravity + CLinternal
Where:
- CLMagnus : Traditional spin-induced lift due to asymmetric boundary layer separation
- CLgravity : A spin-independent, downward bias introduced by gravity's influence on airflow
- CLInternal : A symmetric, spin-dependent contribution from airflow entering and exiting the holes
Because experimental optimization cannot easily separate these effects, the measured CL should be considered an effective lift coefficient, encompassing multiple aerodynamic contributions.
Each component is explored below.
5.1.1 Component 1 — Magnus Lift
The classical Magnus effect arises from differential surface velocities between the advancing and retreating sides of a spinning ball. This shifts separation points, deflects the wake, and generates lift perpendicular to the ball’s trajectory.
In an idealized model, Magnus lift is symmetric: topspin and backspin of equal magnitude should yield equal and opposite lift forces. However, experimental data reveal consistent deviations from this symmetry, suggesting that additional forces are modifying the basic Magnus behavior.
5.1.2 Component 2 — Gravity-Induced Flow Bias
A key hypothesis in this study is that gravity not only affects the ball, but subtly modifies the surrounding airflow:
- Upward-moving air (over the top of the ball) is decelerated by gravity.
- Downward-moving air (beneath the ball) is accelerated by gravity.
This gravitational distortion creates an inherent top-bottom asymmetry in boundary layer momentum — even for a non-spinning ball — leading to earlier separation on top and later separation on the bottom. This shifts the wake upward and produces a net downward lift force across all shots (Figure 15).
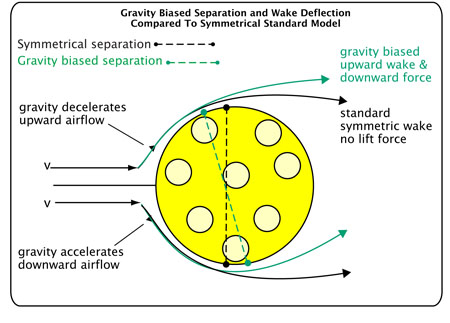
Figure 15: Gravity-modified airflow asymmetry for a non-spinning ball. Gravity accelerates descending airflow and decelerates ascending airflow, creating a persistent asymmetry in separation behavior even without spin. This shifts the wake upward and produces a downward lift force on all free-flight balls. When spin is present, it either reinforces or opposes this baseline gravity-induced wake shift, depending on spin direction.
When spin is introduced, it either reinforces or opposes this baseline asymmetry, depending on the spin direction.
Topspin Behavior:
- Top of Ball (Advancing Surface): Surface moves against decelerated air, enhancing shear and promoting early separation. The wake shifts upward, reinforcing downward lift.
- Bottom of Ball (Retreating Surface): Surface moves with accelerated air, reducing shear and delaying separation, further contributing to downward lift.
Backspin Behavior:
- Bottom of Ball (Advancing Surface): Surface moves against accelerated air, increasing boundary layer momentum and delaying separation slightly.
- Top of Ball (Retreating Surface): Surface moves with decelerated air, promoting early separation.
Thus, for topspin, Magnus and gravity work together, compounding downward lift. For backspin, Magnus and gravity work against each other, weakening upward lift and partially neutralizing the expected spin effect.
This mechanism naturally explains the downward lift bias and the asymmetry between topspin and backspin trajectories.
For a quantitative estimate of gravity’s influence on airflow velocity and boundary layer separation, see Appendix A.
5.1.3 Component 3 — Internal Airflow Effects
In addition to external boundary interactions, the perforated structure of the pickleball introduces internal airflow phenomena:
- Advancing holes scoop external air into the ball.
- Retreating holes allow air to exit as jets.
While hole-scooping is structurally symmetric across topspin and backspin, the external conditions into which the internal air exits are not — they are asymmetric due to gravity-altered airflow:
- Topspin: Air exits downward into a faster, lower-pressure external flow, potentially stabilizing the boundary layer and delaying separation.
- Backspin: Air exits upward into a slower, higher-pressure external flow, which can destabilize the boundary layer and trigger early separation.
Thus, internal airflow effects reinforce topspin lift and undermine backspin lift, amplifying the asymmetry already introduced by gravity.
5.2 Explaining the Flat Backspin Relationship: A Compounded Cancellation
The near-flat, non-dependent relationship between lift coefficient (CL) and spin number (S) for backspin was a surprising result, especially when contrasted with topspin trajectories that show a clear, strong, linear relationship between |CL| and S.
This can be explained by a compounded cancellation of multiple factors eroding the expected effect:
- Gravity accelerates downward flow and decelerates upward flow, working against the Magnus-generated upward lift for backspin.
- Gravity-enhanced boundary layer instability on the retreating side (top of ball) exacerbates early separation.
- Internal airflow jets exit into a slow, decelerated freestream on top of the ball, destabilizing rather than stabilizing boundary layers.
In sum: At the low velocities and spin rates typical of recreational pickleball shots, the magnitude of the gravity-induced lift asymmetry can match or overwhelm the weak Magnus lift, particularly for backspin. However, at higher velocities and spins, as in other sports, Magnus forces would eventually dominate and re-establish a stronger Cl–S dependence even for backspin. At low velocity and spin, backspin’s Magnus effect exists, but it is persistently undermined by gravity-induced flow asymmetries and hole-induced destabilizations. Topspin, by contrast, experiences constructive reinforcement between Magnus and gravity.
5.3 Investigating Low-Spin Lift Coefficients
One of the most revealing features of the data was the behavior of trajectories at very low spin. Even at near-zero spin rates, balls exhibited substantial lift:
- Topspin: CL ≈ –0.24
- Backspin: CL ≈ +0.17
This behavior deviates from classical Magnus theory expectations, which predict CL should vanish when spin approaches zero. The persistence of lift strongly suggests that an additional, spin-independent force — most plausibly, gravity-induced airflow asymmetry — is at work even before spin comes into play.
5.3.1 Baseline Correction and Magnus Isolation
To quantify the non-Magnus contribution, linear regressions of |CL| versus spin number (S) were performed separately for topspin and backspin. The intercepts of these fits corresponded to the "baseline lift" present even without spin.
Subtracting these intercepts revealed the true Magnus component:
- Topspin: A strong positive slope remained, confirming a robust Magnus response.
- Backspin: A nearly flat slope persisted, showing minimal additional lift contribution from spin.
This baseline correction cleanly separates the gravitational and Magnus effects, providing a clearer view of how spin interacts with background aerodynamic biases.
5.3.2 Optimizer Behavior at Low Spin
However, the optimizer’s method for determining lift coefficients introduces an important complication. Because the optimizer minimizes trajectory error without distinguishing causes, it naturally absorbs any consistent aerodynamic force — whether spin-related or not — into the fitted CL value. As a result:
- At low spin rates, the optimizer folds both Magnus-driven and gravity-induced lift into the effective CL.
- Only after correcting for baseline lift can the "pure" Magnus response be isolated.
This reinforces the importance of interpreting all optimized CL values as "effective" rather than purely spin-driven — especially near S = 0, where gravity-driven effects dominate the lift behavior.
5.4 Asymmetry Outcome
Pulling together the effects described above, we observe the following major aerodynamic outcomes:
- Consistent downward force across all spins
- Amplified topspin lift
- Suppressed backspin lift
While these effects were amplified by the pickleball’s perforated surface and free-flight conditions, the underlying mechanism — gravitational distortion of airflow — should apply universally to all free-flight balls to some degree.
Why this effect has likely been overlooked: While gravity-induced airflow asymmetry may apply universally to free-flight balls, it is most detectable at low velocities and spin rates — the very regime explored in this study. At these lower speeds, the gravitational influence on surrounding air is proportionally large enough to shift separation behavior and alter lift outcomes. But in higher-speed sports (e.g., tennis or baseball), or in wind tunnel studies using fixed bodies and uniform flow, the same gravitational effect is often negligible relative to the dominant flow momentum. There, it may simply vanish into background noise or be mistaken for turbulence. By contrast, the present study uses actual free-flight trajectories at moderate speeds, allowing the subtle asymmetries to emerge with measurable and consistent consequences. This suggests that a universal mechanism may have been persistently overlooked — not because it is absent, but because it is typically drowned out by stronger forces in conventional test conditions.
5.5 Toward an "Effective" Coefficient Framework
Given the difficulty of experimentally isolating individual forces, lift coefficients reported in this study should be regarded as effective coefficients — holistic measures capturing all aerodynamic influences (Magnus, gravity, internal flow) simultaneously.
This underscores the value of data-driven modeling: Rather than imposing theoretical assumptions, the optimizer infers the forces required to replicate reality — even when those forces include unknown or overlooked mechanisms.
5.6 Implications and Future Work
This study opens several pathways for deeper exploration:
- CFD Simulations: Testing gravitational effects on boundary layer separation and wake formation.
- High-Speed Flow Visualization: Observing flow asymmetries and internal jetting phenomena.
- Wind Tunnel Tests: Comparing forces under static conditions to free-flight behavior, validating or refining gravity-influenced aerodynamic models.
- Custom Ball Designs: Manipulating hole distribution to test internal airflow hypotheses.
- Time-Resolved Spin Tracking: Mapping dynamic interactions between spin, orientation, and aerodynamic forces throughout a trajectory.
5.7 Conundrums and Unresolved Questions
Despite the coherence of the three-component model, open questions remain:
- What mechanisms sustain significant lift at zero spin — particularly in backspin trajectories?
- Are internal airflow effects strong enough to fully explain the observed residual lift?
- Can turbulent boundary layers shaped by gravity and spin interaction create stable asymmetric wakes?
- How do these effects evolve dynamically over full-length trajectories?
Future experimental and computational work is needed to further untangle these mechanisms.
6. CONCLUSION
This study set out to experimentally measure and better understand the aerodynamic forces acting on indoor and outdoor pickleballs in free flight. Using high-speed trajectory analysis and reverse-engineered force modeling, we calculated effective drag (CD) and lift (CL) coefficients across a wide range of spins, launch speeds, and ball types.
The key findings confirmed that:
- Drag coefficients were relatively stable for a given ball type, but higher for indoor balls with larger holes.
- Lift coefficients for backspin showed far less dependence on spin than expected, while both topspin and backspin demonstrated substantial and unexpected lift even at very low spin levels.
- A consistent asymmetry exists between topspin and backspin: topspin produces stronger lift forces than backspin of equal magnitude — contrary to classical Magnus theory expectations.
To explain these anomalies, we proposed a revised aerodynamic model that extends beyond traditional spin-driven lift. This model incorporates:
- A gravity-induced bias in airflow, accelerating air downward and decelerating it upward, promoting earlier separation on top and delayed separation on bottom — leading to a persistent downward lift force on all shots.
- An internal airflow mechanism, wherein air entering and exiting through the ball’s holes interacts with the boundary layer, reinforcing or disrupting separation depending on external flow conditions.
- Recognition that the optimized CD and CL values extracted from free-flight trajectories represent effective coefficients — embedding all aerodynamic contributions, not just classical drag or Magnus lift.
Together, these factors suggest that the aerodynamics of perforated balls like pickleballs cannot be fully explained by conventional models alone. Free-flight experiments reveal subtle forces — gravity-affected flow, hole-driven internal interactions, and aerodynamic instabilities — that meaningfully shape ball behavior during play.
While the hypothesis of gravity-modified airflow offers a simple and unifying explanation for the observed anomalies, it is acknowledged that such an effect has not been commonly reported in previous aerodynamic studies. This is likely due to the dominance of wind tunnel testing, where static ball conditions and horizontal flow suppress vertical gravitational effects on the air itself. In contrast, free-flight trajectories allow subtle gravity-induced biases in boundary layer momentum to influence flow separation. Although the absolute magnitude of these effects is small, their amplification through separation dynamics may explain their measurable impact on lift forces. Further targeted experiments are warranted to isolate and quantify these contributions.
Finally, the clarity with which these asymmetries emerge in this study may reflect less a new force than a new window into its visibility. By working at lower velocities and with free-flight trajectories — rather than fixed-body or high-speed models — the experiment isolates a regime in which gravity’s influence on airflow becomes measurable. This may explain why the phenomenon has been largely overlooked in past research: it is not absent at higher speeds, but simply obscured by more dominant effects. The findings invite a reconsideration of subtle but potentially widespread aerodynamic biases in all ball sports, especially those operating in low-velocity, spin-variable environments.
Acknowledgements
The authors acknowledge the use of OpenAI's ChatGPT-4 (April 2025 version) for assistance in text editing, summarization, and concept refinement. All research and theoretical and conceptual development were provided by the authors, and final interpretations, analyses, and conclusions were independently developed and verified by the authors.
References
Steyn, D., Mithrush, T., Koentges, C., Andrews, S., & Plourde, A. (2025). Executing a Successful Third Shot Drop in Pickleball. arXiv:2501.00163 [physics.soc-ph].
Creer, I. (2023). Computational Fluid Dynamics Analysis of Pickleball. Bachelor's Thesis, Brigham Young University–Idaho.
Emond, K., Sun, W., & Swartz, T. (2024). Pickleball Flight Dynamics. SportRxiv / International Journal of Racket Sports Science, 6(2).
Rossmann, J., & Rau, A. (2007). An experimental study of wiffle ball aerodynamics. American Journal of Physics, 75(12), 1099–1105.
APPENDIX: QUANTIFYING GRAVITY'S EFFECT ON LOCAL AIRFLOW
A central claim of this paper is that gravity can subtly modify the local airflow over a ball in free flight — especially in the upstream region before flow separation. Although gravity is weak relative to pressure gradients and inertial forces, even small alterations in boundary layer momentum can shift the separation point and wake direction. This appendix provides a basic quantitative estimate of gravity's potential effect on local airflow velocity.
A.1 Determining Gravity Along the Flow Path
As air flows around the front hemisphere of the ball (from the stagnation point toward the top or bottom), a component of gravity along the surface path acts either opposing or aiding the local flow, depending on position. To estimate this, we define:
- r = radius of the ball = 0.037 m
- g = gravitational acceleration = 9.8 m/s²
- θ = angle measured from the stagnation point (0° at front center, increasing upward or downward along the ball surface)
The local component of gravitational acceleration that modifies the tangential flow is:
(1) ag(θ) = g · cos(θ)
At θ = 0° (the stagnation point), gravity fully opposes upward-flowing air and aids downward-flowing air:
- ag,top = –9.8 m/s²
- ag,bottom = +9.8 m/s²
But this component diminishes with arc angle. At θ = 45°, the influence is reduced by √2/2 ≈ 0.707; at θ = 90° (apex), ag = 0.
A.2 Estimating Cumulative Velocity Change
We estimate how much gravity changes the local flow speed as air travels from θ = 0° to θ = 90°, using arc length s = (π/2)·r ≈ 0.0581 m. Assuming an average flow speed v ≈ 10 m/s (a representative freestream value), the transit time over this arc is:
(2) Δt = s / v ≈ 0.0581 / 10 ≈ 0.00581 s
Using an average gravity component over this arc (roughly 0.64·g), we estimate the cumulative velocity change:
(3) Δvtop ≈ –9.8 · 0.64 · 0.00581 ≈ –0.0365 m/s
(4) Δvbottom ≈ +0.0365 m/s
This implies that as air moves over the top of the ball, its speed may be decreased by ~3.7 cm/s, while air flowing under the ball is increased by the same amount for a total velocity difference of Δvtop-bottom ≈ 07.4 cm/s — solely due to gravity acting with or against the flow.
A.3 Amplification via Boundary Layer Sensitivity
To determine the directional effect of gravity on local airflow along the ball’s surface, we resolve gravity into its component along the tangential direction of the surface. This is done using cos(θ), where θ is the angular position of a point on the ball measured from the horizontal front (stagnation point). Maximum influence occurs at the front of the ball (θ ≈ 0° and 180°), where gravity acts most directly with or against the air stream.
Importantly, gravity influences not just the bulk free-stream air but every layer within the boundary layer, each of which moves at a different speed. Slower layers near the surface have lower momentum and are more vulnerable to small opposing forces. As gravity decelerates the ascending boundary layer (e.g., on the top-front of the ball), it disproportionately weakens the already-slow inner layers, triggering earlier separation. Conversely, when gravity aids the flow (e.g., on the bottom-front), it boosts those layers, helping them remain attached longer. This differential effect across the layer structure amplifies asymmetry and explains how small gravitational forces can create a significant aerodynamic outcome.
Thus, even a weak force like gravity can produce a measurable aerodynamic effect — not by acting directly on the ball, but by subtly tipping the balance in the already delicate structure of the boundary layer.
Thus, although gravity acts weakly on air, the combination of early-stage projection, separation sensitivity, and internal jet interference makes its aerodynamic influence plausible — particularly under the free-flight, low-speed conditions of pickleball trajectories.
A.4 Conclusion
Accounting for gravity’s directional influence via cos(θ), the net differential in freestream velocity between the top and bottom of the ball’s front arc is approximately 0.07 m/s. While small in magnitude, this falls within a range known to influence separation timing. When combined with internal airflow and turbulent instability, such asymmetry is sufficient to explain measurable aerodynamic effects — including persistent downward lift and the topspin–backspin asymmetry reported in this study.