Abstract: Physics Experiment To Determine Role of Racquet Mass in Tennis Impact
The purpose of the experiment was two-fold. The first goal was to determine how much of a beam or racquet is actually used during impact and what affect does that have on the rebound velocity of the ball. The amount of mass "used" is known as "effective mass" and is easily measured or calculated (in tennis nomenclature, effective mass is referred to as "hittingweight"). However, effective mass can have different values depending on when you measure it — at ball separation or several milliseconds later. This can cause problems when analyzing causal relationships to other data like ball rebound velocity. The two techniques are compared to each other and their consequences analyzed. To that end, several combinations of beam and ball materials were used in order to generalize the findings.
The main objective, however, was to derive an intuitive, step-by-step, physical model explaining how effective mass comes to be and how and why the ball rebounds accordingly. In other words, "How does the ball know how much mass it has collided with and therefore how fast to bounce?" Accomplishing the first objective was simply a tool to accomplishing the second.
Tennis players are interested in effective mass because more mass is associated with more ball velocity. Tennis racquets are not uniform beams, but the distribution of mass is not so variable that they can't be considered as such to close enough approximation. However, the experiments below involve only uniform beams, not racquets. It is simpler to decipher the physics of simple, uniform objects first, and then extrapolate those findings to more complicated, nonuniform, asymmetrical objects. It is actually easier to discover how a racquet might behave using a beam than by using a racquet. That being the case, feel free to substitute "racquet" for "beam" whenever you would like.
Introduction
At impact, the ball compresses and the beam bends. At first, the beam does not move or rotate, it only bends. That is because only a small local portion of the beam has felt the impact. A bending wave emanates in both directions down the beam. During impact, the wave's maximum possible travel distance is equal to its propagation speed times the impact duration. This distance may be more or less than the distance to the end of the beam. If it is more, than it will reflect off the end and travel in the other direction. Each bit of beam along the way gets pulled into the bend, but as it does so, it also pulls back on the previous bit trying to restore equilibrium. This is a two-way information channel. Information going out says “bend,” and information coming back says “restore.” It is the returning restore messages that tell the ball how much mass it has collided with. The beam will keep bending until enough “restore” messages arrive back and their forces summed to change the ball's direction and eject it.
Figure 1 illustrates the process. It takes time for the bend-restore messages to travel in each direction out and back. Therefore, on either side of the impact location, the maximum possible distance the ball will "feel" will be less than the maximum distance travelled by the bending wave. From each point along the beam, the bending wave will always travel an equal distance forward as the restore feedback wave travels backward. Therefore, in Figure 1, the outward distance "felt" by the ball (up to point A) will be half the outward distance travelled by the bend (2A). The total distance travelled in the feedback circle (dout1 + dback = 2A) will be the same distance that the wave travels, with or without reflection from the end (dout1 + dout2 = 2A). As the impact point moves toward an end, it gets more complicated, but the principle remains the same. We will discuss those situations in the "Building a Model" section.
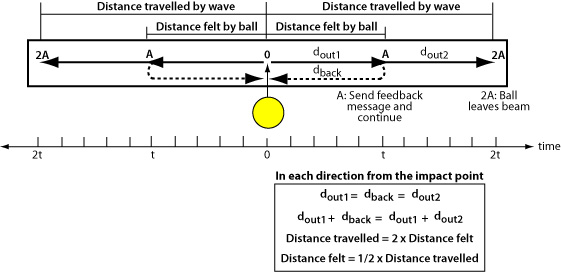
Figure 1 — Beam experienced by the ball vs beam travelled by the bending wave. The total distance felt by the ball is the sum from both sides of the impact point. At point A (in fact, at all points), feedback is sent back to the ball. As the message travels backward, the wave travels an equal distance forward. Thus, at any time that the ball leaves the beam, the wave will have travelled twice the distance as that felt by the ball.
The ball doesn’t know whether it saw all or part of the beam, but it has to act as if the beam were, in fact, only what it has felt so far. The ball will bounce “as if” the beam had a mass and length based on what it has “felt.” This “as if” behavior is also referred to as “effective,” as in, “the ball effectively bounced from a beam of such and such mass,” or “the ball bounced from a beam having an effective mass of such and such.”
If the wave does not travel to both ends of the beam and back before the ball leaves, then the beam has not yet moved or rotated, it has only bent. In fact, at this point, the beam doesn't know its own length, weight, center of mass, or vibration frequency. As the wave makes several trips up and down the beam, all the energy that initially went into bending gets sorted out into linear, rotational, and vibrational motions, and the beam's identity crisis is alleviated as it discovers its properties. By then the ball is long gone.
This is difficult to visualize. Videos 1 and 2 help make this clearer. These show a 145 g lacrosse ball striking a 183 cm, 1195 g wood beam. Video 1 shows impact at the center and shows bending sort itself into translation and vibration. Video 2 shows an off-center impact where the bending sorts out into translation, vibration and rotation. In both cases, the ball rebounds before the sorting occurs and before it could receive any of that feedback even if it had occurred.
Video 1
Impact in middle of beam
Movie Screen 1 — A ball incident at 90 degrees at the middle of the beam. Advancing through the impact one frame at a time (double arrow video control below), it's seen that, at first, the beam bends only locally. At the moment of rebound, the bend has just arrived at the ends, but there is no evidence of the entire beam translating yet. Moving forward by several frames, the beam is bending back and forth about an average location which itself is visibly translating. At the instant of ball exit, the speed of the effective mass was the speed of the bend. Several frames later, the speed of the bend is separated into vibration and translation of the entire beam mass. The former will calculate as smaller mass travelling faster, and the later will calculate as a larger mass travelling slower.
(Note: Use "double-arrow" movie controls for frame-by-frame play.)
Video 2
Off-center impact
Movie Screen 2 — A ball incident at 90 degrees at about 20 cm away from the middle, causing rotation. Advancing one frame at a time (double arrow video control below), it's seen that the ball leaves before translation, vibration, and rotation are resolved. At this point, to the ball, the speed and distance of the bend is the translation. So the effective mass is small and the effective translation speed is high. Several frames later, the bend motion is divided into translation, vibration and rotation.
(Note: Use "double-arrow" movie controls for frame-by-frame play.)
If the ball does not know if it bounced from the whole beam or not, could this be a problem for the law of conservation of linear (translational) momentum which says that the total linear momentum of the objects after the collision must equal the total before. An object’s momentum is the product of mass times velocity, so which mass obeys the law — the effective mass or the actual mass? The conservation equation looks like this:
(1) mvball1 + MVbeam1 = mvball2 + MVbeam2
where m and M are ball and beam masses respectively, vball1 and Vbeam1 are ball and beam velocities before impact, and vball2 and Vbeam2 are ball and beam velocities after impact. In these experiments, the beam was stationary at impact so Vbeam1 = 0.
Fortunately the law works with both masses. Because the effective mass will be less than the actual mass, the deflection speed at the impact point will be greater (it being the sum of what later will be separated into linear, rotational and vibrational speeds). And after the beam has sorted out all the motions, the actual mass will be greater than the effective mass, but the velocity will be slower. The exchange rate between mass and velocity is perfect and the conservation result for both the effective or actual momentums is the same.
The Experiment
Purpose
The purpose of the experiment was to determine how much of a beam or racquet is truly utilized during impact at different locations along the beam (i.e., effective mass) and what effect does that have on the rebound velocity of the ball. Different time-dependent methods of measuring effective mass were compared and analyzed in terms of their abilities to explain the ball's rebound speed. And last, an explanatory model of the events determining effective mass was developed.
Method
A wood or aluminum beam was hung from long lengths of string and impacted with different kinds of balls swung as a pendulum. The impact locations were at 10 cm intervals measured from the center of the beam out to one end. The beams and balls are described in Figure 2 and Table 1. Various combinations of materials, lengths, and ball types were used to generate different impulse forces, durations, velocities, and wave travel distance — the goal being to create situations where the bending wave both did and did not reflect off the ends and back to the impact location before the end of the impact. A reflected wave that makes it back to the origin will affect the effective mass, and one that does not will not have any effect.
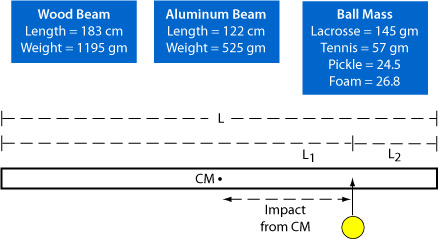
Figure 2 — Experiment geometry.
| Table 1 Properties of Beams and Balls | ||||
|---|---|---|---|---|
| Beam Material | Beam Length (cm) | Beam Mass (g) | Ball Type | Ball Mass (g) |
| Wood | 183 | 1195 | Lacrosse | 145 |
| Aluminum | 122 | 525 | Tennis | 57 |
| Aluminum | 122 | 525 | Pickle | 24.5 |
| Aluminum | 122 | 525 | Foam | 26.8 |
Table 1 — Beams and balls.
A high speed camera was located above the collision and videoed at 300 fps. The video was digitized and analyzed in Tracker Motion Analysis software. Before and after velocities were obtained by digitizing the ball and beam for several video frames immediately after separation. Beam velocity was also measured with an accelerometer attached behind the impact location and from which beam velocity could be measured at the instant of separation. A piezoelectric disk was also (sometimes) attached either in front at the impact location to measure impact duration or at one end to measure impulse speed. The instrument outputs were recorded by a Picoscope digital oscilloscope and spectrum analyzer.
Measuring the ball velocity is not as time sensitive as measuring the beam velocity. As long as you are not measuring an edge of the ball in the direction of its compressive vibration, the measurement will be accurate enough in the first 20 ms after collision, during which the speed will not decrease enough to matter for most purposes. The beam velocity is a different matter. Because the deflection speed of the impact location is part linear, rotational, and bending speeds, deflection speed needs to be measured before any of this is sorted out. Beam velocity was measured with both the accelerometer and the video methods so that the time dependent results of each method could be compared with each other.
Energy Return Calculations
Rebound efficiency is measured by the coefficient of restitution (COR or e) and the apparent coefficient of restitution (ACOR or eA).
COR is given by the ratio of the relative velocities of the colliding objects before and after the collision:
(2) COR = (vball2 - Vbeam2) / (Vbeam1 - vball1)
where vball1 is the incident ball speed perpendicular to the beam and vball2 is the rebound speed perpendicular to the beam. Vbeam2 is the beam velocity at the impact location after collision, and Vbeam1 is the velocity before collision (0 in these experiments).
ACOR is defined as the ball's outgoing speed perpendicular to the beam divided by its incident perpendicular speed:
(3) ACOR = vball2 / vball1
Both ratios are almost always between 0 and 1.0 — 1.0 indicating no linear energy loss and 0 indicating total loss in the collision. The energy is "lost" because some energy goes into heat and sound production, but more importantly, some has been diverted into bending. Most bending energy is typically not returned to the ball. This "lost" bending energy is later divided in two — "lost" vibrational and rotational energies. ACOR can be negative if the ball does not change direction during impact (as did occur in the experiment at the tip of the beam). ACOR is a more convenient measurement when you are only interested in the results for one of the colliding objects, like the shot speed of a tennis ball, and also when the velocity of one of the objects is more difficult to measure (like a tennis racquet).
Effective Mass Calculations
Effective mass can be derived using the restitution results (Equations 2 and 3):
(4) Me = mball (1 + e
or by using the conservation of momentum relationships (Equation 1):
(5) Me = m (vball1 + vball2) / Vbeam2
These formulas tell you what happened but not how it happened. If you know the velocities after the collision, then you just plug them into the formula and you can determine what the effective mass must have been to result in those velocities. But how did the effective mass come to be, which, then, was responsible for the velocities? To find out, we will reverse engineer beam-ball impacts to discover some of the inner workings.
Effective mass is dependent on impact time and propagation velocity. In other words, it depends on the maximum distance the bending wave can travel in both directions from impact and still have time to get the restoration force messages back to the impact location before the ball leaves. Once the restoration forces equal the peak impact force, the ball will reverse direction and begin to rebound.
Results
Comparing Effective Mass Methods
Once ball and beam velocities are measured, effective mass of the beam is calculated using equations (4) or (5). Figure 3 shows the effective mass of the wood beam being hit by a lacrosse ball. The video measurement of beam velocity was calculated as the average over 40 ms (12 frames) after separation in order to average out the effects of vibration on the determination of beam position. Beam velocity measured by the accelerometer was at the instant of separation (i.e., time = 0).
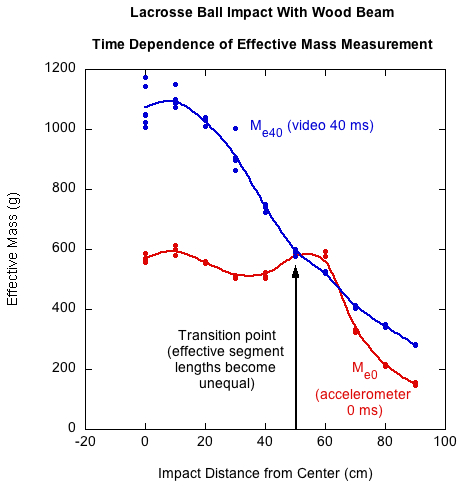
Figure 3 — Comparison of effective mass measured at 0 ms and 40 ms after impact for the lacrosse ball impacting the wood beam. At 50 cm, the effective segment lengths become unequal as feedback arrives of the bending wave coming to a beam end.
The time-delayed video curve shows the situation after the linear, rotational and bending velocities have been separated. In this case, if the impact is at the center of mass, then there is no rotational motion and the effective mass nearly equals the actual mass. As impact moves toward the end, there is more rotation, the beam moves away more quickly, and the effective mass decreases. For the time-delayed curve fit, effective mass decreases continuously from the CM outward.
On the other hand, the instantaneously determined effective mass remains relatively constant for impacts from the center to about 50 cm, beyond which it rapidly decreases. This will be the case as long as feedback of the bending wave reaching the beam end does not arrive back to the ball before rebound. For the wood beam, the first impact location for which news of a beam-end encounter arrives back to the ball is at 50 cm. For every impact point beyond that, there is progressively less mass encountered by the bending wave, and, as a result, beam deflection velocities increase and effective mass decreases.
These two curves look very different. What does that mean to ball rebound velocity? It would be reasonable to think that different effective masses would result in different rebound ball speeds — a ball bouncing from a heavier object bouncing faster. If that is the case, it would seem that each effective mass curve would be associated with different ball rebound speeds, which of course can't be true because both measurements are of the same event — the ball rebound speed is what it is. How does this all get worked out?
Ball Rebound
First, it has to remembered that we are talking about the beam's "effective" mass and "effective" velocity. We have also seen that the magnitude of these is time dependent. But both the effective mass and velocity depend on something that is not "effective" — the beam's momentum. This is shown by solving for v2 in each of equations 1 and 3, substituting Me for M, setting the results equal to each other, and solving for ACOR. Equation 6 shows this result.
(6) eA = (MeV2 / v1) - 1
where MeV2 is the momentum of the beam after impact and v1 is the velocity of the ball before impact.
Equation 6 shows that ACOR depends on not just the effective mass of the beam, but also its velocity, the product of both being the beam's momentum. Surprisingly, mass times velocity of both curves at any location is the same. So, since ACOR depends on this invariant momentum, it is not altered if the time-dependent effective mass and velocity change relative to each other as long as their product remains the same. Figure 4 shows the effective masses and velocities of both the instantaneous and time-delayed measurements plus the momentum which is the same for both.
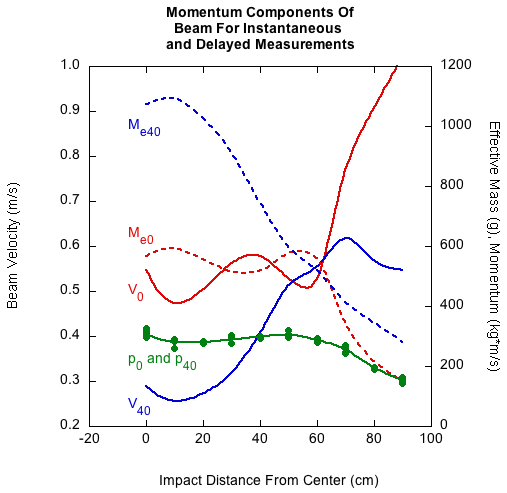
Figure 4 — Though the effective masses and velocities are very different for each measurement (subscripts 0 and 40), the product of these, the momentum (p), is the same for each.
Since ACOR depends on beam momentum, it will be the same for each measurement, even though the components (effective mass and velocity) are different for each. But, at the time of the bounce, ACOR must certainly correlate better to one effective mass than the other. Figure 5 confirms this. At the moment of separation, ACOR tracks with Me0, not Me40. That is because at this stage of the rebound, the beam has not had time to separate the momentum into translation, rotation, and vibration — to the ball, it is all simply translation of a mass equal in magnitude to the results of the bending-restore feedback circle. From the beam's point of view 40 ms later, it has divided the beam deflection into translation, rotation, and vibration. The translation component is reduced, so the effective mass component is increased to keep momentum the same. The beam is saying, "this is what theoretically happened," and the ball is saying, "this is what effectively (actually?) happened in real time before there was vibration and rotation and when bending and translation could not yet be distinguished from each other."
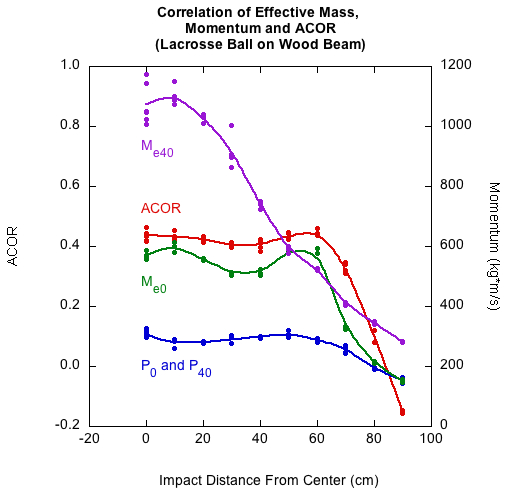
Figure 5 — Correlation of ACOR with Me0, not Me40.
This being the case, how does the ball find out what this "real time" effective mass is?
Building An Explanatory Model Of Effective Mass and ACOR
Effective mass is "as if" mass. That is, for a ball to rebound at a given velocity, the beam must have behaved "as if" it was a given mass. Effective mass implies an effective length and effective velocity to travel that length in time t. Available to us are real parameters such as impact duration, impact location, beam mass and length, ball mass, incident and rebound ball velocities, beam deflection amount and velocity, and all parameters that can be derived from these.
Most of what is included in effective mass is actual mass. But "as if" behavior can include other things that themselves can act as if they were mass. The most important of these is bending wave reflection from the end and arrival back at the impact location before the ball leaves. Wave reflection can increase or decrease the effective mass, and with it, the corresponding effective length and information velocity.
Sneak Peak: Model Compared To Actual
At the risk of putting the cart before the horse, Figure 6 shows a comparison of the model results with the actual effective mass — both results are exactly the same. With that end in sight, what follows explains how we get there.
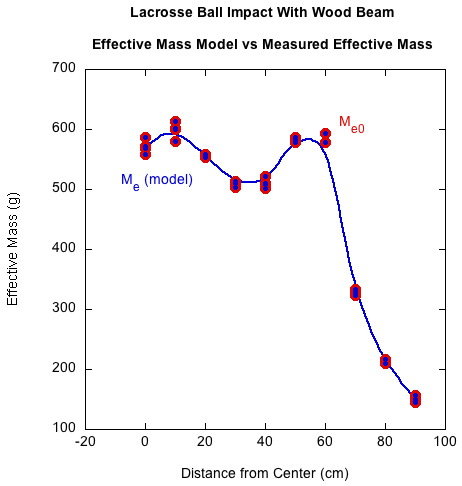
Figure 6 — Comparing the results of the effective mass model with the measured effective mass. The results are exactly the same — the model curve lies on top of the measured curve.
Step 1: Dissecting An Impact
The impact location divides the beam into two sections along which the bending wave will travel in each direction. Except for impacts in the middle of the beam, there will be a long segment (
The main assumption in determining the mass experienced by the ball is this: the maximum distance that the ball can "feel" that the wave has travelled is half the maximum distance the wave itself can travel during impact. As the bending wave proceeds, the beam bits that are displaced resist and reciprocally pull back, rippling back a restoration wave, as each bit affects both the one in front and behind it, which then do the same to their neighbors. That constant back and forth takes time. It takes the same time to travel back with the resist-and-restore message from point A as it took for the bending wave to travel to point A. So, the wave travels a maximum distance during impact, but the impact point is notified of a maximum of only half that. We will be referring to the maximum possible distance the wave can travel as Dmax, the maximum distance it can travel and still deliver feedback to the ball as "felt distance," or Df, and the actual distance it does travel due to available beam in either direction as "effective segment length", or Le1 or Le2. We will derive these distances and velocities starting with only the measured effective mass, the beam's length and mass, and the impact duration (t).
First we will determine effective velocity (ve) and then the maximum or actual wave velocity (vw). The effective velocity is the velocity at which the wave would travel in each direction in order to travel the distance given by the effective length (Le — Eq. 7). As we have seen, the actual wave velocity (vw) will be twice that. The effective mass (Me — mass felt by ball) is given by measurement, and since the beam is presumably of uniform geometry and density, the effective length will be proportional to the effective mass:
(7) L e = L (Me / M)
where Le is the effective length and L the beam length.
It's tempting to then say ve = Le / t (where t is the impact duration), but that won't work, as will become more clear below.
Instead, the following procedure was used. We know the effective length, so if we map that onto the beam by placing its center on the impact location, we can then calculate the two effective segment lengths by subtracting the overflow from one end of the effective length and adding it to the other (Figure 7).
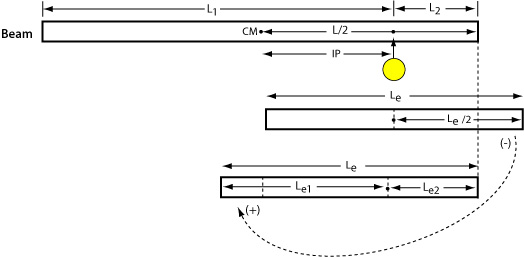
Figure 7 — Determining effective lengths of segments.
The effective distance travelled on the short segment is determined as follows:
(8) if
Le / 2 ≥ L2
then,
Le2 = L2
else,
Le2 = Le / 2
where Le is effective length, L2 the length of segment 2, and Le2 the effective length of segment 2.
Then, the long section will be
(9) Le1 = Le - Le2
The effective velocity on Le1 (the long segment), and thus also, Le2 (the short segment), will be
(10) ve = Le1 / t
where ve is the effective velocity, Le1 the effective length of segment 1, and t the duration.
Although the effective velocity will be the same on each segment, the travel times will be different. For the long segment (segment 1), the time will be the impact duration (t). For the short segment (segment 2), the time (t2) will less as given by
(11) t2 = Le2 / ve
Step 2: Diagram The Impact
We have to step back here. Even though we have established effective mass, length, velocity, and segment lengths, we still want to visualize the mechanism by which they came to be.
Wave Travel Distance. We stated earlier that the wave velocity was actually twice the effective velocity:
(12) vw = 2ve
Given enough beam, the maximum distance the bending wave could travel during impact along each of the two segments is
(13) Dmax = vwt
where Dmax is the maximum distance in each direction that the wave can travel during impact, vw is the velocity of the bending wave, and t is the impact duration. Figure 8 shows Dmax as measured from each impact point (IP). The figure shows that there is not enough beam to accomodate the Dmax curve on the top segment, but there is plenty of room in the bottom segment. If there were enough beam, the distance between the two purple Dmax curves is the maximum bending region that could occur while the ball was still in contact. As we will see below in "wave reflection distance," the hump in the curves is not because the wave propagation speed actually suddenly increased (and with it the distance and mass encountered), but because at those points, the reflected wave also affected the impact point to behave as if its mass were greater.
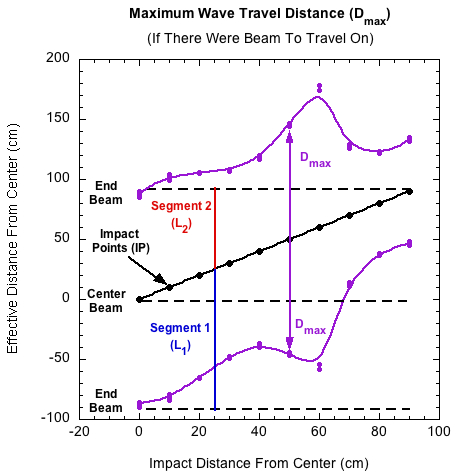
Figure 8 — The maximum distance (Dmax) the bending way could travel in each direction during impact from the impact point (IP) if the beam were long enough.
Maximum Wave Felt Distance. However, it is not the maximum bend that the ball will feel, even if there were sufficient beam. The maximum distance the wave could travel and still influence the ball's rebound is half of Dmax. This is the "felt distance" (Df).
(14) Df = Dmax / 2
where Df is the is the maximum felt distance. Figure 9 shows this result. Notice on the upper segment that Df also exceeds the end of the beam. So, for any impact location, if there were enough beam, the distance between the two green Df curves is the maximum bending distance that the ball could experience.
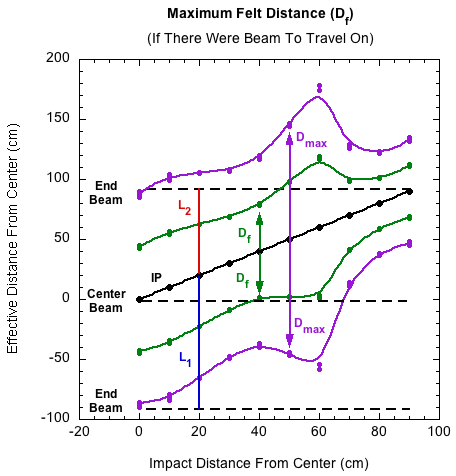
Figure 9 — The maximum distance the bending way could travel during impact from the impact point in each direction and have time to send a restore force message back to the ball.
Effective Wave Distance. The qualifier "maximum" is important because it requires the beam segment to be long enough. Any given segment may be longer or shorter than Df. If the segment is shorter than the maximum length over which information can be sent back, then the effective segment length will be equal to the actual length of the segment. If the segment is long enough to accommodate the maximum possible feedback loop, then the effective segment length will be equal to Df. These effective segment lengths (and their masses) are what the ball sees, experiences, and reacts to. Though we already determined the effective length of the segments in equations 8-11, we do so again here but by using different concepts and terminology as well as the aid of figures 10-12. The effective length of segment 1 (the long segment) is determined as follows.
(15) If
(Df < L1)
then,
Le1 = Df
else,
Le1 = L1
where Df is the maximum possible felt distance on segment 1, L1 is the length of segment 1, and Le1 is the resulting effective length of segment 1.
The effective length of segment 2 is determined in the same way:
(16) If
(Df < L2)
then,
Le2 = Df
else,
Le2 = L2
where Df is the maximum possible felt distance on segment 2, L2 is the length of segment 2, and Le2 is the actual ("felt," "experienced") effective length of segment 2. Figure 10 shows these maximum felt distances in each direction. Notice that L2 reaches the end of the beam for impacts around 50 cm and beyond. L1 is coincident with Df on the lower end (as indicated by the green dots and blue curve).
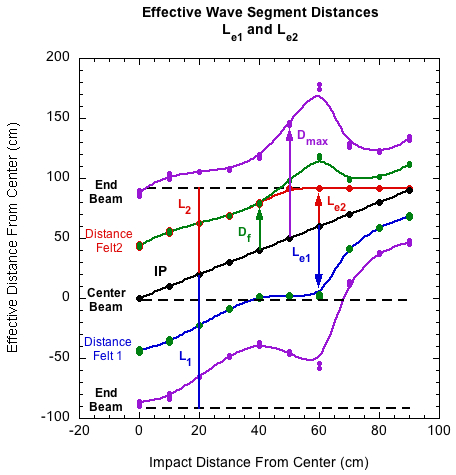
Figure 10 — The blue and red curves represent the maximum effective distance the bending way could travel during impact given time and beam to travel on. This is the max felt distance in each direction from which the ball can receive feedback (Distance felt 1 = Le1 and Distance felt 2 = Le2).
The effective length of the beam is then,
(17) Le = Le1 + Le2
where Le is the effective length of the beam. That is the length of the beam "felt" and "experienced" by the ball. Figure 11 shows this as the distance between the blue (Le1) and red (Le2) curves. Up to 50 cm, the effective length is basically constant. As far as the ball is concerned, it is hitting at the same place of the effective beam (the effective center). It takes no notice that the impacts are getting further toward the end of the beam — until one of its feedback segments actually encounters the end.
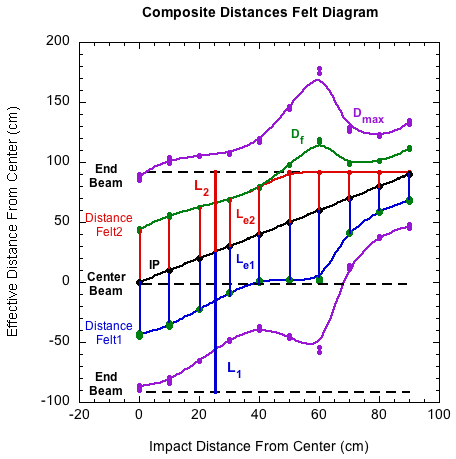
Figure 11 — Effective "felt" lengths in both directions from the impact point (Le1 and (Le2).
And because the beam is of uniform mass distribution, the effective felt mass of this length of beam is
(18) Me(felt) = Mbeam (Le / L)
where Me(felt) is the effective mass during impact and Mbeam is the mass of the beam.
Wave reflection distance. Why do the effective lengths (Le = Le1 + Le2) increase between impacts of 40 and 60 cm? Segment 2 length is decreasing, and with it its mass contribution. One would assume segment 1 would continue on the same slope as the curve between 0 and 40 cm, and thereafter between 70 and 90 cm. What happened in between? Wave reflection happened.
Impulse waves propagating in beams do not keep their symmetric, single spike shapes like they do in more ideal mediums such as strings and air. Each impulse is made up of many wave frequencies. The higher frequency waves travel faster than the lower ones. So as the impulse wave travels to the end and back, it spreads out with the higher frequency, lower energy modes leading the way, and lower frequency, higher energy ones following. When the wave reflects off the end, it interferes with itself. Overlapping waves are said to be in superposition. When the reflected wave arrives back to the impact point, it may still be in superposition or simply in its dispersed, spread out state. Either way, it may act to increase the bending speed and thereby decreasing effective mass, or it may act to decrease bending speed, adding to effective mass. The results depend on the phase and amplitudes of the reflected wave packet.
The purple maximum distance curve (Dmax) in Figures 8-11 doesn't go off into space. It gets reflected from the end of the beam and travels in the opposite direction. Because the reflected wave is moving towards the impact point, it is not sending information back to the ball like the outgoing wave did. It is bringing the information itself. Therefore, the speed of the reflected message to the ball is 2ve. If we simply invert the purple curve (orange curve), we see how far back down the beam the wave will reflect before the ball leaves (Figure 12). This is the reflection distance (Dr). The intersection of the reflected curve and the black IP curve is the impact location that first experiences the reflected wave before the ball leaves. The distance below the black IP line indicates how far the reflected wave passed through the impact point and affected the ball-beam interaction. All impacts from the intersection out to the end of the beam get reflected back at least to the impact point. This is depicted wherever the orange reflection curve is below the impact point curve. This area is coincident with the area where the effective lengths and masses increase between 40-60 cm, before then plunging in rapid decline. It follows that the reflected wave effectively increases effective length, and thus, also, effective mass.
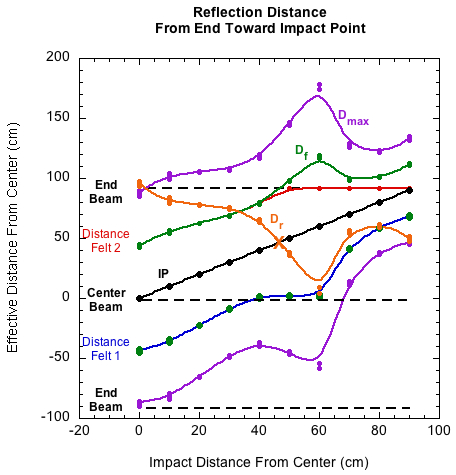
Figure 12 — The distance the reflected wave travels back down the beam is shown as the reflection distance curve (Dr). At all point below the impact point curve the wave reflected past the ball while it was still in contact with the beam.
How this occurred is a bit counter-intuitive. When waves reflect off free, unsecured ends, they maintain the same phase. That would mean it would tend to increase beam bending when it got back to the ball. One would think that would increase beam deflection speed, deflection, and duration, thus indicating less mass. In fact the opposite happens. Instead, because the ball has already reversed direction and is pushing off the beam, the reflected wave hastens ball separation, so, at the moment of separation, the duration, deflection, and deflection speed all decrease, indicating impact with more effective mass. This is shown by the increase in both effective mass and ACOR in this region between 40 and 60 cm from the center.
For impacts from 0 to 40 cm, virtually all the effective mass is just mass. No ends of the beam have been encountered and no reflection has occurred. Each impact occurs in the middle of the effective length, which itself is a derivative simply of mass. When impact approaches the end, one segment becomes shorter than the other and reflection becomes a factor. In this region, the effective mass includes other influences masquerading as mass. The ball does not care whether the mass is real, or effective, or "as if."
Model Comparison To Measured Results
We will call this method of reconstructing Me at the moment of separation as the "mass-felt" method.
Does Me(felt) agree with the actual measurement of Me0 that we began with? Figure 13 shows the results for the lacrosse ball impacting the wood beam. Three curves are compared: Me0, Me40, and Me(felt). The mass-felt method perfectly replicates the Me0 curve.
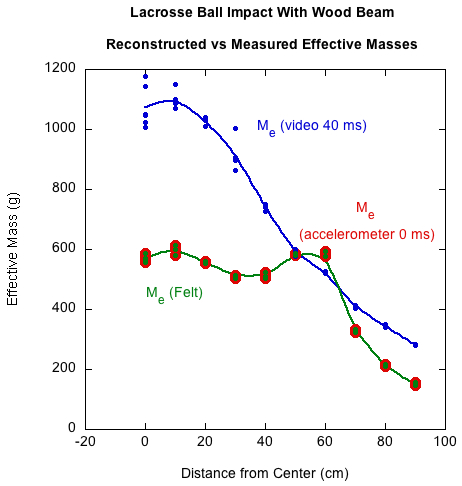
Figure 13 — Comparing the mass-felt method (Me(felt)) of reconstructing effective mass with the accelerometer at ball separation (Me0) and the video measurement averaged over 40 ms (Me40). The mass-felt method perfectly replicates the Me0 curve.
As further demonstrated in "Other Beams and Balls" below, the mass-felt model is an accurate pedagogical model for describing effective mass.
Other Beams and Balls
The presentation above focused only on one beam and ball (lacrosse ball impacting wood beam) in order not to confuse the explanations with two many beam/ball specific differences. Having the explanations in hand, we can now look at the situation-specific results. For each ball/beam combination, two graphs are presented: (1) comparing the results of Me0, Me40, and Me(felt), along with ACOR, and (2) the mass-felt model of diagraming impacts. (Note: the aluminum beam length is 122 cm instead of the 183 cm wood beam. However, the same analysis applies throughout even though the graphs look different due to different material, balls, propagation speeds, and length.)
Tennis ball on aluminum beam:
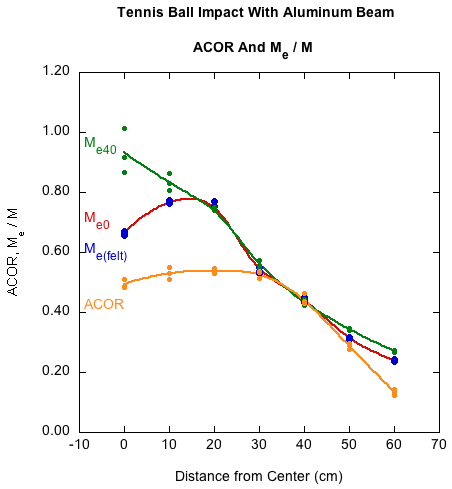
Figure 14 — Tennis ball on aluminum beam — Comparing the mass-felt method of reconstructing effective mass (Me(felt)) with Me0 and Me40 and comparing ACOR against each.
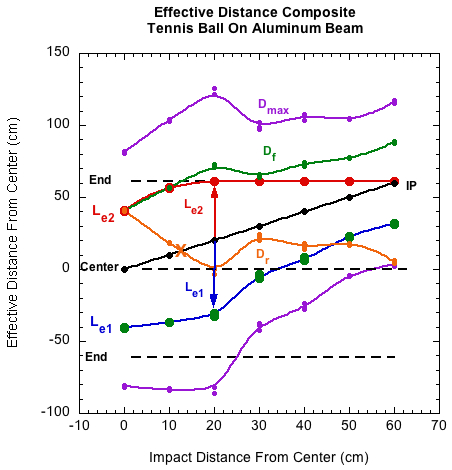
Figure 15 — Tennis ball on aluminum beam — Me impact diagram.
Pickle ball on aluminum beam:
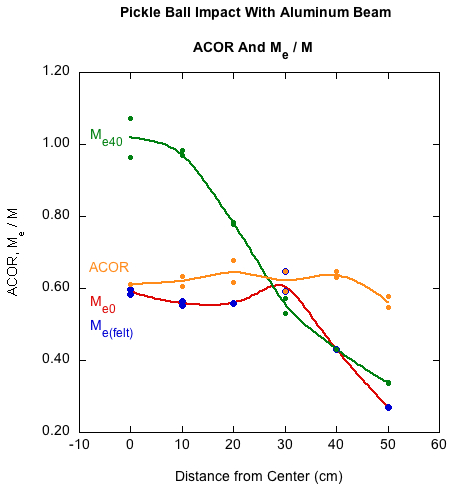
Figure 16 — Pickle ball on aluminum beam — Comparing the mass-felt method of reconstructing effective mass (Me(felt)) with Me0 and Me40.
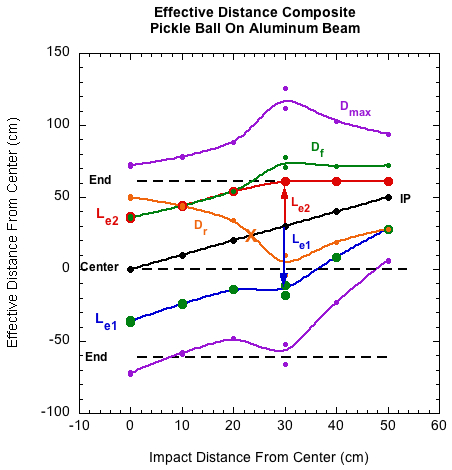
Figure 17 — Pickle ball on aluminum beam — Me impact diagram.
Soft foam ball on aluminum beam:
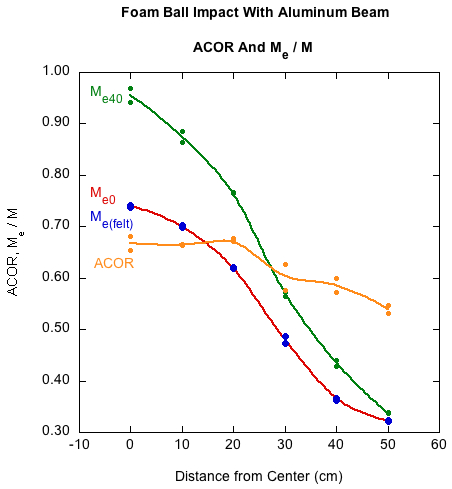
Figure 18 — Foam ball on aluminum beam — Comparing the mass-felt method of reconstructing effective mass (Me(felt)) with Me0 and Me40.
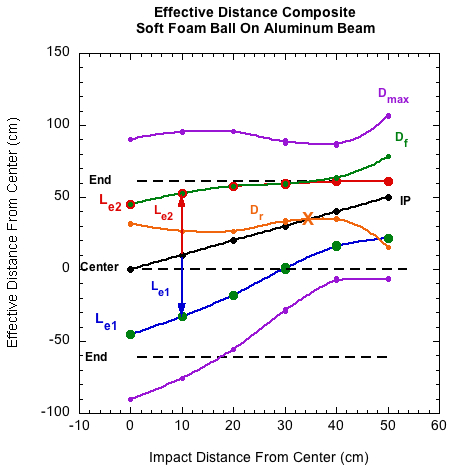
Figure 19 — Foam ball on aluminum beam — Me impact diagram.
Conclusion
We have answered all of our initial questions: How does the ball know how fast to bounce, when does it know it, and how does it know it?
If you are designing or customizing a tennis racquet, one of the primary concerns is the effective mass at the hitting location. This, is the key determinant in how fast the ball will rebound, which is the whole point of a racquet. A player wants to either maximize or optimize effective mass to obtain a desired performance. Analyzing the behavior of uniform beams provides a simpler more generalizable method of understanding what goes into such an optimization.
The results of an effective mass calculation depends on when measurements were performed vis-a-vis impact duration — at the moment of separation or several milliseconds later. To explain how fast the ball bounced from the beam, you need the first. To explain the linear rebound speed of the beam, you need the latter. During impact, what the ball experiences is beam deflection or bending. After the ball leaves, the beam decides how much of the energy that went into deflection will then be divided up between linear, rotational, and bending motion.
To the ball, impact at every location is virtually the same until the effective length of one of the impact segments becomes shorter than the other. Until that occurs, the ball experiences virtually the same effective mass and ACOR. Once impact occurs at this transition point and beyond, effective mass and ACOR will start to radically decline. This is also the distance from the center where the bending wave gets reflected back to the impact location before the ball leaves. In fact, it is at this transition region where the greatest amplitude portions of the reflected wave move through the impact location, with the greatest effect on effective mass and ACOR. Consequently, both effective mass and ACOR might increase immediately before the rapid decline.
The procedure of reverse engineering of impacts has a bit of inevitability about it. Because we start with the answers (Me, ACOR, and any quantities derived from them, such as effective wave speed and length), one would expect to get the exact answer one is looking for. But this is only true if legitimate assumptions are made concerning the processes involved. The key is "legitimate" assumptions. Everyone knows how difficult it is to take something apart and then put it back together again with all its parts in the right place and working together. The Mass-felt model of diagraming the development of effective mass not only works, but more importantly, is an easy, all-at-once visualization of the impact finger-print of any ball-beam combination. This method is both a good analytic and pedagogic tool.