ABSTRACT
An experiment was performed to determine the effect of temperature on the stiffness, elongation, tension loss and maintenance of tennis strings. Players often wonder how storing their racquets in the trunk of their car during extreme hot or cold weather would influence tension and performance? Likewise, will a tennis racquet perform differently at different temperatures, or will the stringbed stiffness be affected if the racquet is strung at different temperatures?
1. INTRODUCTION
A common question among tennis players is whether or not they should string their racquets differently in winter vs summer, or from hot days to cold days. Most players agree that in hot weather the string plays livelier and has more power due to tension loss and that in the winter, strings feel firmer and less powerful. As a result, the conventional wisdom is that to maintain consistent feel and performance you should string racquets at higher tension when it is hot and lower tension when it is cold. But how much higher or lower? A complicating factor is that the ball also changes performance with temperature. The player may also feel stiffer on a cold day. What players feel when hitting in various temperature conditions is the combined effect. This experiment was undertaken to quantify the effect of temperature on string.
It is common knowledge that most strings lose a large percentage of tension with time and play. The amount is highly material specific, with gut, nylon, and polyester losing the least tension in that order. Do variations in temperature exposure affect tension loss in these materials differently? Does it matter when the string is exposed to a temperature extreme — before, during, or after tensioning? How do variances in tension loss due to temperature changes affect the most important property of string — stiffness?
The strings were each given an Identification number from 1-15 (14 was omitted). The strings were as follows:
- 1. Luxilon Alu Power 1.38 (polyester)
- 2. Double AR 666 1.30 (nylon)
- 3. Luxilon 4G Rough 1.25 (polyester)
- 4. Double AR Diablo 1.24 (polyester)
- 5. Tecnifibre HDX Tour 1.30 (nylon)
- 6. Head Lynx 1.30 (polyester)
- 7. Volkl V-Torque 1.18 (polyester)
- 8. Head FXP Tour 1.30 (nylon)
- 9. Gamma Live Wire XP 1.32 (nylon)
- 10. Wilson NXT Duramax 1.40 (nylon)
- 11. Wilson Optimus 1.30 (nylon)
- 12. Ashaway Crossfire 1.25 (kevlar)
- 13. Wilson Natural Gut (gut)
- 15. Head Rip Tour 1.30 (nylon/polyolefin)
2. EXPERIMENTAL ARRANGEMENT
Two experimental setups were utilized to analyze the connection between string properties and temperature — one to measure tension loss due to varying the time at which a string was exposed to a given temperature (before, during, or after stretching), and the other to measure stiffness, elongation, and tension loss after different temperature exposures.
Setup #1 — Tension vs timing of heat application. The first setup (Figure 1) was used to measure tension vs time for strings with different temperature exposure histories.
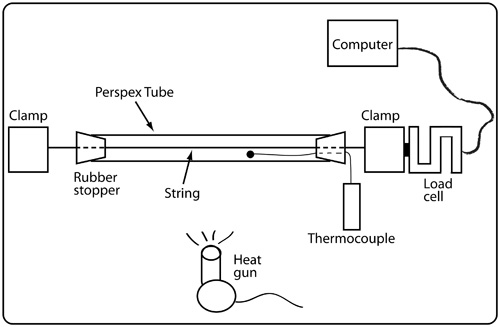
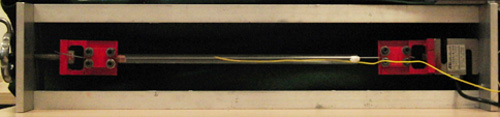
Figure 1 — Experimental setup for measuring tension loss vs time for strings with different temperature exposure histories.
A string was inserted inside clear perspex tube with two open ends and through a small hole in a rubber stopper at each end of the tube. The string ends extended past the end of the tube and were clamped. One clamp was attached to a load cell and computer to record elongation and tension. The other end was attached to a hand crank that pulled the clamp in the rig to stretch the string. The distance between clamps was 35 cm.
Tests with this apparatus were conducted at 20° C and 40° C. 20° C was room temperature with air conditioning. The 40° C tests were performed in two ways: first by heating the string to 40° C with a heat gun just prior to tensioning the string to 28 kg (62 lb) and then letting the string stabilize at constant elongation for 100 seconds. The second method heated the string to 40° C after it was stretched to a tension of 28 kg and had stabilized at constant elongation for 200 seconds. Heating before tensioning would simulate the effect of temperature during the stringing/tensioning process. Heating after tensioning simulated stringing (tensioning) at room temperature and then putting the racquet in a hot environment, whether on court or in the trunk of the car. A thermocouple inside the tube recorded the temperature. The ends of the tube were closed off to keep the temperature as constant as possible during the test. Fourteen strings were tested: 1 gut, 1 kevlar, 7 nylon, 5 polyester.
1a — Heat before tensioning. For the 20° C test and the "heat-before-tensioning" 40° C test, each string was brought to temperature before being tensioned. Strings were stretched until they reached a tension of 28 kg (about 62 lb). Tension and temperature drop was then recorded until 100 seconds. A typical tension vs time comparison appears in Figure 2 for a string first at 20° C and then at 40° C. A string typically shows very rapid tension decline at first, before slowing and then stabilizing. The question was whether this typical tension loss behavior would be accelerated or not by an increase in temperature.
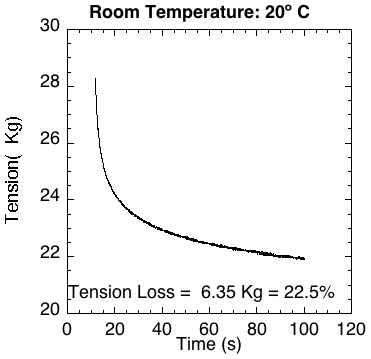
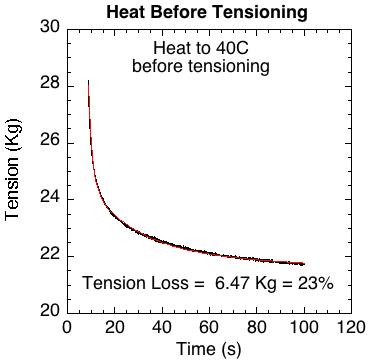
Figure 2 — For most of the strings tested, there was little difference in tension relaxation between being tensioned at normal room temperature (left or top) and at 40° C (right or bottom).
1b — Heat after tensioning and stabilization. For the heating during the tension loss phase, the starting temperature was 20° C. Tension was increased to 28 kg and 200 seconds were allowed to pass. This phase was similar to the pre-tensioning heating test but an additional 100 seconds was added to allow tension to stabilize. The question of concern was whether adding heat after stabilization would start (or accelerate) tension loss. At 200 seconds, the string was heated to 40° C. This took about 100 seconds. The string was then allowed to cool for 200 additional seconds. Tension was recorded throughout the process. Figure 3 shows a typical result for this process.
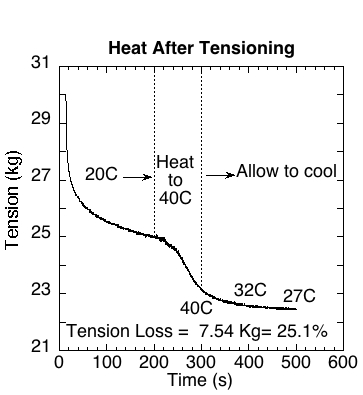
Figure 3 — Tension vs time for the same string as Figure 2 but following the heating-after-tensioning protocol.
Setup #2 — Stiffness, Elongation, and Tension vs Temperature. The second apparatus was a materials testing machine (Figure 4). The setup was essentially the same as in Figure 1 but a computer controlled stretching program was different. This machine measured string tension vs elongation. From that data, the lengthwise stiffness of each string was calculated.
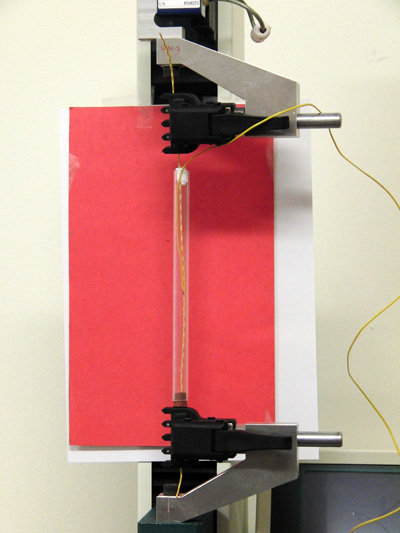
Figure 4 — Experimental setup for testing stiffness and string tension vs elongation.
A string was secured between two clamps 200 mm apart at start and running through a clear perspex tube with rubber plugs in each end. The machine stretched the string at 100 mm/min until tension reached 280 N. There was a 100 second wait during which tension loss was recorded. Then the stretch continued at 100 mm/min up to 380 N. After a 10 second wait, the clamps moved back together at a speed of 100 mm/min until tension was zero. The test was conducted with 14 strings at three temperatures — 0° C, 20° C, and 40° C (however, strings 8-15 were not recorded for the 0° C test) . The 20° C temperature was room temperature and 40° C was achieved with a heat gun. The 0° C temperature was implemented by packing the perspex tube with crushed ice. The thermocouple recorded the temperature. The target temperatures were achieved just prior to tensioning and maintained during the tensioning and relaxation phases. A typical result is shown in Figure 5 at 20° C.
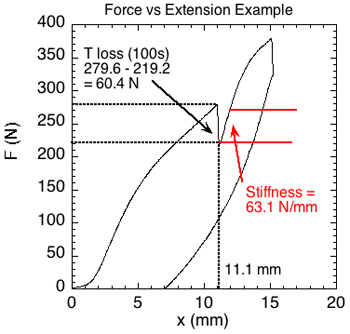
Figure 5 — Typical graph of string behavior using a materials testing machine to stretch string at 0, 20, and 40 degrees centigrade.
3. RESULTS AND DISCUSSION
Results for Setup #1 — tension loss vs timing of heat application. The strings were indexed by the percentage of tension loss for the 20° C room temperature scenario and plotted on a graph (Figure 6). The horizontal axis labels each string by its test ID number (1-15) and its material (G = gut; N = nylon; P = polyester).
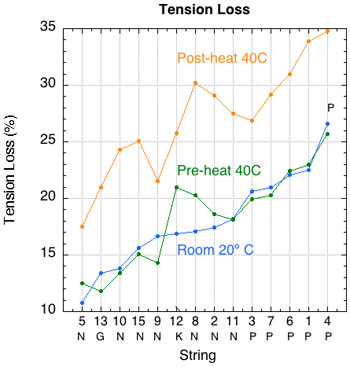
Figure 6 — Composite view of tension loss by string and temperature history (indexed in order of tension loss at room temperature of 20° C).
The expected result was that the tension loss would increase for each string by about the same amount, regardless of whether it was heated before tensioning or after tensioning. The result differed from expectation in that, except for 4 strings, the 40° preheat scenario had the least loss of tension. It wasn't much less and one might be tempted to say that for practical purposes there was no difference. But there is a possible explanation for the behavior, though it was not measured during the test. Heating the string, whether before or during tensioning increases the mobility of the molecule chains. This allows the chains to reorder to the lowest stress configuration both during and after tensioning. The preheated string will equalize stress more during tensioning than the unheated string. Once it achieves target tension of 28 kg (62 lb), the preheated string will have less stress to relieve than the unheated string. It will, however, continue to equalize stress after tensioning more quickly than the unheated string, so will lose a bit more tension than the unheated string.
The most striking result is how much tension is lost during the 40° C post-tensioning-heating scenario compared to room temperature. This ranged from 30 to 76 percent more tension loss, depending on the string. Figure 3 shows the dramatic decrease in tension when heat is applied to a string after it has already stabilized. Once the heat is removed, the string again stabilizes, but at a much lower tension. Figure 6 shows the result of post-heating for each string.
Tension stabilization continues forever, but at a continually decreasing pace. As long as there is stress, some molecular bonds will continue to reorient to less stressful positions given enough time. Equilibrium occurs when all molecular bond attractions are greater than the tension trying to tear them apart. But if heat exposure occurs after tensioning and stabilization, the molecules become agitated and begin to move relative to each other. Now the equilibrium between the tension and the bonds is broken. As bonds break and reorient, tension decreases. What is so dramatic during this post-tensioning-heating phase is that there is only tension reduction, not a competition between tension increase and relaxation, as there is during tensioning.
Results for Setup #2 ‐ Elongation, Tension and Stiffness vs Temperature. The stiffness tests closely approximated the expected result that stiffness would have an inverse relationship to increase in temperature. Thus, each string at 0° C was stiffest, followed by 20° C and 40° C (Figure 7). The differences, however, were not great. The difference in stiffness between temperatures for each string was greater for the nylon strings.
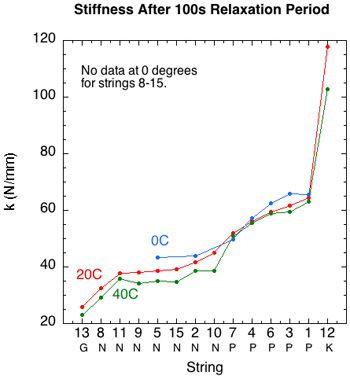
Figure 7 — Stiffness by string, material, and temperature exposure immediately after the 100 second relaxation period.
Figure 7 is qualitative in that the horizontal axis is simply the itemization of each string, and thus each curve does not demonstrate any quantitatively causative relationships. If we graph post-relaxation stiffness vs temperature for each string, we begin to see some patterns. Figure 8 presents just such a picture grouped by materials. Only string number 7 does not fit the pattern of stiffness being inversely related to temperature.
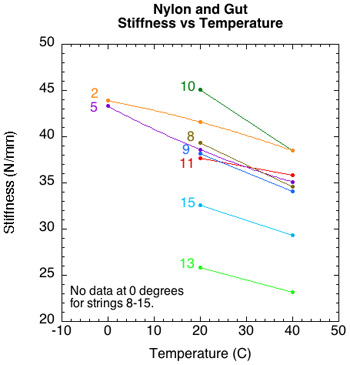
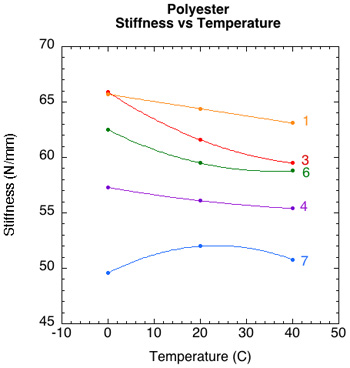
Figure 8 — Closeup of stiffness vs temperature for each nylon and polyester string.
The stiffness, k, is calculated as k = dF/dx, where dF is the increase in the force when elongation increases by dx. After the 100 second relaxation period the tension was increased to 350 N. Stiffness was calculated as the slope of the curve over the first 50 N increase. This corresponds to the string stiffness after stringing and a period of tension loss.
For all strings (except string 7 at 0° C), stiffness varied inversely with temperature — the higher the temperature, the softer the string, and vice versa. The stiffness of the gut and nylon strings seemed to be more sensitive to temperature than did the polyester and kevlar strings. Stiffness is the most important property of strings. It is the net result of the effects of elongation, tension, strain rate and temperature. Most players focus on tension, but that is only useful in as much as it predicts stiffness, which is often the case for comparing an individual string at different tensions but not for comparing different strings to each other.
Elongation. Elongation also behaved as expected — it increased with temperature (Figure 9). Higher temperature allows weak secondary bonds between the polymer chains to break. The result is more viscous behavior with chains slipping, sliding, and reorienting relative to each other. This allows more elongation at lower stresses than occur at lower temperatures.
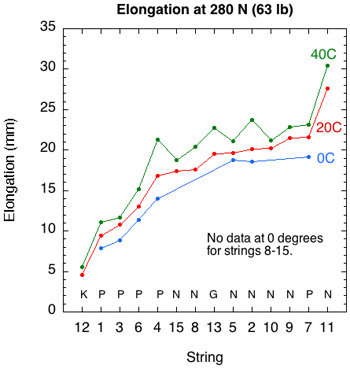
Figure 9 — Elongation by temperature in setup #2.
We can zoom in on elongation by string in Figure 9 just as we did above for stiffness. Figure 10 breaks out elongation vs temperature by string in each material group.
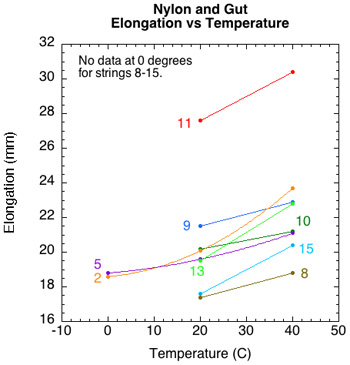
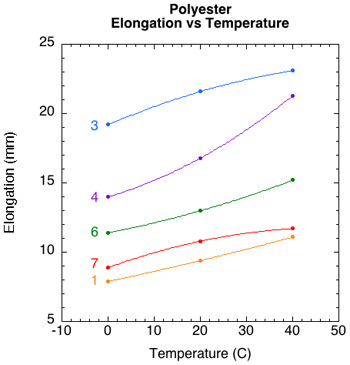
Figure 10 — Closeup of elongation vs temperature for each nylon and polyester string.
Tension Loss. Tension loss by temperature is shown in Figure 11. The results are not quite as tidy and a bit unexpected. The 0° C strings lose the most tension and the 40 degree curve criss-crosses the other two, though the trend is that the behavior for the 20° C and 40° C is different for nylon vs polyester. For nylon, the 40° string loses more tension than the 20° string. It is the other way around for polyester — the 20° string loses more tension than the 40° string.
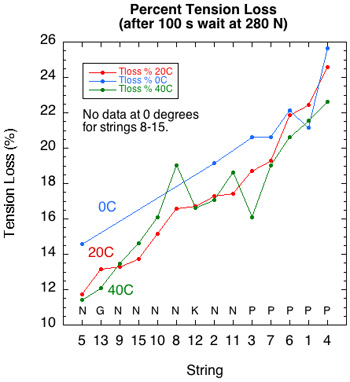
Figure 11 — Tension loss by temperature in setup #2.
Figure 12 zooms in on tension loss behavior for each nylon and polyester string.
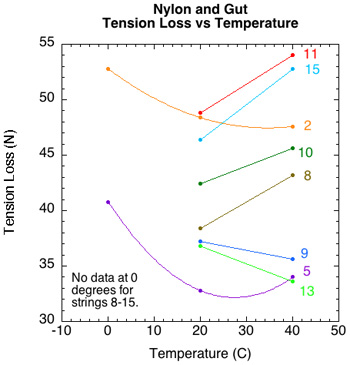
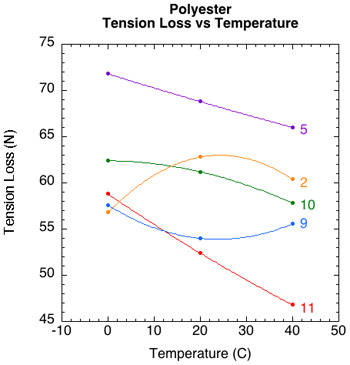
Figure 12 — Closeup of tension loss vs temperature for each nylon and polyester string.
This is not the expected result. Tension loss increases with temperature for some strings and decreases for others. What is happening?
Tension loss is due to the reordering of molecular bonds to the lowest stress equilibrium available at any given moment. This reordering occurs during both the stretching and post-stretching phases. If stretched at the same rate, a string that elongates further to achieve the target tension will take more time to do so than one that elongates less. As shown in Figure 10, elongation is proportional to temperature. So, in the stretch phase, colder strings elongate less and provide less time for the molecular bonds to respond to the stress caused by the stretch. Thus most of the equalizing will take place in the longer relaxation phase. Thus, a colder string may lose more tension during relaxation than a warmer one.
An example of how relaxation tension depends on the tensioning time is shown in Figure 12.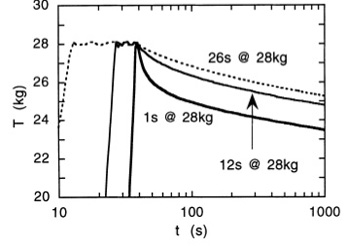
Figure 12 — Tension vs time for a string tensioned to 28 kg for several different time intervals prior to clamping. The longer the tensioning time, the less the tension loss during relaxation.
On the other hand, the thermal energy of a warmer string helps break weak bonds between molecule chains, allowing greater flow and elongation of the string during stretching. This increases the time it takes to achieve the target tension. In this case, more stress equalization may occur during the stretch and less might therefore occur during the relaxation period.
It is the interplay between stretch rate, stretch amount, stretch duration, temperature, and stress relaxation that effects the amount of tension loss that occurs only in the relaxation period (the period that was measured to get "tension loss"). But because stress relaxation occurs at varying rates both before and after achievement of target tension, the magnitude of tension loss during the relaxation period (i.e., after the racquet has been strung) does not necessarily correlate to the total relaxation that has occurred nor to the final stiffness of the string. It is the relaxation that occurs both during and after the stretch that is significant.
Stiffness is the property that measures the result of all these elongation, duration, and relaxation processes. And we saw in Figures 7 and 8 that stiffness is proportional to temperature. Stiffness decreases with an increase in temperature and increases with a decrease in temperature. That is the important take away.
Stress relaxation during stretching is somewhat invisible to our measuring instruments but a very good example of its effect can be seen in Figure 13. A thousand seconds after achieving target tension and being clamped off, the string that took only 1 second to stretch to target tension lost almost 3 Kg more tension than the one that took 26 seconds. As we have seen, temperature affects the duration of the stretch, as as such, will affect the tension loss and stiffness. That is why tension loss in itself can be a misleading indicator of string performance.
Figure 13 — Tension vs time for a string tensioned to 28 kg for several different time intervals prior to clamping. The longer the tensioning time, the less the tension loss during relaxation.
4. CONCLUSION
Tennis string is affected by temperature, but not always in the manner that one might expect. Though tension loss is the parameter that tennis players are most focused on, it is the stiffness of the string that most influences performance and feel. Tension is a component of stiffness.
The greatest effect observed in this experiment was that exposing a string to high temperatures after post-tensioning stabilization/relaxation has occurred (as in leaving the racquet in the car during hot weather) produces the greatest decrease in tension. Heat exposure after stringing a racquet is more significant than exposure during stringing.
Stiffness and elongation are proportional to temperature, though the effect is not great. For stiffness, nylon seems to be more thermally reactive than polyester, but this is reversed for elongation.
Tension loss in itself is a misleading parameter because it is part of the larger concept of stress relaxation. Stress relaxation occurs both during and after stretching. Tension loss is defined as just that part that occurs after stretching. As such, tension loss is just a partial and often misleading participant in determining string stiffness — the most important parameter in string performance.
The "take-away" is twofold: First, if you like firm/stiff playing strings, do not expose them to higher than usual temperatures after stringing. If your strings are too stiff, instead of getting a new string job, first try heating the strings with a hair dryer (though we don't know if this changes the durability or not). This type of heating has a permanent effect. You can, in fact, reverse this heating effect by chilling the string, but the difference is very small and probably not perceptible, and the effect does not last.
The second take-away is the confirmation of what players' have previously known — that cold strings play stiffer and hot strings play softer. This is expected. Confirming beliefs and behaviors is as important, if not as sexy, as exposing the myths and follies of our concepts. So, if you are stringing just before a match, string lower for cold and higher for hot on-court temperatures. You can get an idea of just how much by looking at the percentage difference in stiffness resulting from the temperature exposures. Table 1 shows the percentage spread from 0-40° C, from 0-20° C, and from 20-40° C. Because strings 8-15 did not have any data at 0° C, "NA" appears in those cells. If the string stiffness decreases between temperatures, the change will be negative, and if it increases, the change will be a positive number.
| Table 1 Percentage Change in Stiffness by Temperature Range | |||||
| String ID Number | String | Material | Difference in Stiffness 0-40° C (%) | Difference in Stiffness 0-20° C (%) | Difference in Stiffness 20-40° C (%) |
|---|---|---|---|---|---|
| 1 | Luxilon Alu Power 1.38 | Polyester | -18.9 | -10.9 | -9.1 |
| 2 | Double AR 666 1.30 | Nylon | NA | NA | -10.73 |
| 3 | Luxilon 4G Rough 1.25 | Polyester | NA | NA | -5.0 |
| 4 | Double AR Diablo 1.24 | Polyester | NA | NA | -10.1 |
| 5 | Tecnifibre HDX Tour 1.30 | Nylon | NA | NA | -14.6 |
| 6 | Head Lynx 1.30 | Polyester | NA | NA | -12.0 |
| 7 | Volkl V-Torque 1.18 | Nylon | -12.3 | -5.2 | -7.5 |
| 8 | Head FXP Tour 1.30 | Nylon | 2.4 | 4.8 | -2.3 |
| 9 | Gamma Live Wire XP 1.32 | Nylon | NA | NA | -10.1 |
| 10 | Wilson NXT Duramax 1.40 | Nylon | -3.2 | -2.1 | -1.2 |
| 11 | Wilson Optimus 1.30 | Nylon | -5.9 | -4.8 | -1.2 |
| 12 | Ashaway Crossfire 1.25 | Kevlar | -9.7 | -6.5 | -3.4 |
| 13 | Wilson Natural Gut | Gut | -4.0 | -2.0 | -2.0 |
| 15 | Head Rip Tour 1.30 | Nylon/polyolefin | NA | NA | -12.6 |
Table 1 — Percentage change in stiffness between temperature spans.