ABSTRACT
Cushioning is an important performance characteristic of tennis shoes. It is accomplished by altering the geometry, thickness, location and combination of sole materials. Studying a shoe as an entity allows one to assess the cushioning properties of the shoe as a whole. We, instead, were interested in how singular, uniform foams behave when exposed to dynamic impact loads similar to those experienced during foot plant. Knowing how a foam behaves in the general case allows extrapolations about individual footwear components, shoes, and performance.
Several masses were dropped from varying heights onto foams of different material, thickness and combinations of layers. Force, acceleration, deformation, load time, load rate, and stiffness were measured and compared. Masses were also dropped onto concrete and calculations of force and deceleration reduction compared to concrete were performed to compare materials on a singular, objective scale.
1. INTRODUCTION
Cushioning is one of the primary considerations when buying a tennis shoe. Cushioning affects comfort, performance, and injury prevention. Players typically determine a shoe's cushioning by squeezing the midsole by hand, comparing the sole's thickness to other shoes, or by wearing the shoe and standing, walking or bouncing in the store. Such methods can give an indication of how a sole might perform while playing tennis, but they are not always reliable. The foams and rubbers used in soles can perform differently at different impact speeds, forces, angles, thicknesses and in combination with other materials. A sole can be a complex amalgam of materials and structure whose properties can only be ascertained by testing and measuring performance under conditions and forces experienced in play. We have previously done several such experiments: Tennis Shoe Cushioning and Tennis Shoe Traction.
For this experiment, we were interested in something more basic — how do uniform samples of foam of different materials and thickness behave when impacted by different masses traveling at different speeds? This would be a primary question to answer if one were building a shoe from scratch. Testing a shoe answers how the shoe behaves. Testing the raw materials gives better insight into why and how a shoe behaves as it does.
The foams tested in this experiment were not specifically those used in shoes. All foams behave similarly under stress, and it is simply the magnitude of the behavior that differs, so a selection of foams that can be found in hardware, furniture, or fabric stores were adequate. Those chosen offered a range of stiffness, thickness, and viscoelasticity that allowed testing properties under various conditions. The foams varied in thickness and stiffness — a 15 mm thick thong (flip flop), 21 mm foam (seat cushion), 4 mm yoga mat, 6 mm floor mat, and 15 mm floor cushion mat, 75 mm seat cushion, 3 mm Sorbothane, and an 11 mm rubber. However, most of the results reported here pertain to the first two, referred in the study as "15 mm thong" and "21 mm foam." The thong was stiffer than the foam. These best illustrate the similarities and differences in foam behaviors.
2. EXPERIMENTAL ARRANGEMENT
Two experimental procedures were used:
- Ball Drop Test
- Dynamic Impact Device Test
A full range of impact energies were tested in order to fully map the behavior of the foams. While the ball-drop test produced forces far below any that would be experienced during sports activities, the dynamic impact device produced activity-appropriate forces. Combining the two results together gives a full picture of a foam's behavior.
2.1. Ball Drop Test
Steel balls were dropped onto 50 mm diameter samples of the material. Different masses (5 g - 534 g) were dropped from the same height (100 mm), or the same mass (67 g) was dropped from different heights (50 - 225 mm). In that way different impact energies and momentums were created. The foam sample was secured with double-sided tape to a flat, 50 mm diameter piezo. The changes in piezo voltage during impact were recorded on a digital oscilloscope and the entire event was videoed at 300 fps. The force, acceleration, deformation, velocity, and duration were obtained by analyzing the piezo and video results.
Figure 1 shows first a photo of the ball drop setup (with 15 mm thong) and then shots of the 7 masses at the moment of maximum compression of the 21 mm-thick foam. The balls were all dropped from 100 mm.
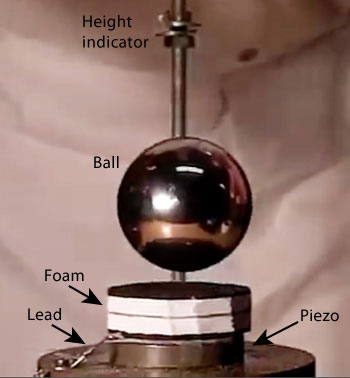
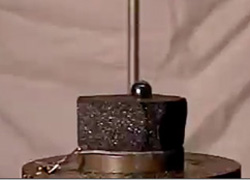
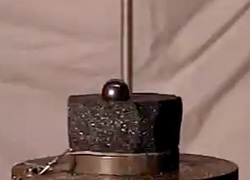
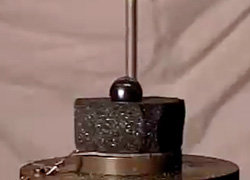
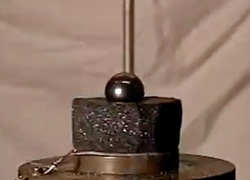
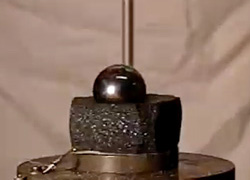
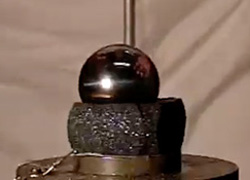
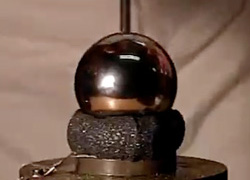
Figure 1 — Ball drop experiment: Balls were dropped from a height of 10 cm onto a 50 mm diameter section of various foams. Ball masses above from smallest to largest: 4.09 g, 8.33 g, 16.3 g, 28.12 g, 66.76 g, 225.3 g, 533.8 g. Each image is at maximum compression as captured by video at 300 fps. The foam is 21 mm thick.
2.2. Dynamic Impact Device Test
Figure 2 shows the dynamic impact device used to test higher impact energies.
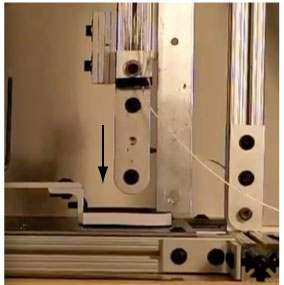
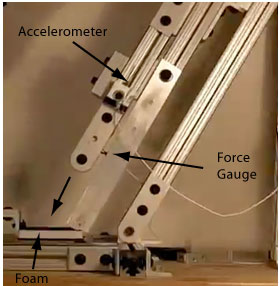
Figure 2 — Dynamic Impact Apparatus: Setup for measuring cushioning for 90 and 60 degree impacts from horizontal. The displacement transducer (LVDT) is hidden in the image but is attached to the back of the device behind the accelerometer.
Foam sections were placed on a steel plate and secured in place at both ends of the segment. A gravity driven missile was used to impact the foam. The missile mass was varied from 2.45 kg to 7.5 kg. The impact head had a radius such that at impact the contact dimensions were 38 mm x 15 mm, and after 10 mm of compression, the contact was 38 mm x 35 mm. A force gauge was inserted between the impact head and the main beam of the missile. An accelerometer was mounted to the missile beam 15 mm above the contact point. A linear variable differential transducer (LVDT) to measure foam deformation was attached to the other side of the beam. The missile was manually elevated from 20 to 150 mm above the foam and dropped.
3. RESULTS AND DISCUSSION
Impact conditions for each foam sample were varied by changing five "impact variables" — the drop mass and height (i.e., velocity), thickness, material, and layering of different materials. The combination of mass and height determines the impact energy and the thickness determines the amount of material available to absorb that energy. In order to simplify and standardize analysis and comparisons, we combined all three variables into one common input by dividing impact energy by foam thickness. The result is known as the energy density and is in units of Joules per mm (J/mm). The impact energy was defined as the potential energy of the dropped object, which depends only on the mass and height.
(1) energy density = U = mgh / T
where U is energy density, m is mass, h is drop height, T is foam thickness and mgh is potential energy in Joules.
The results were analyzed in two ways — by comparing a singular material to itself under each impact condition and also by comparing one material to another with respect to each condition. For the first case (Section 3.1), we will look primarily at the 15 mm stiff thong material. For the second case we will compare the 15 mm thong to the 21 mm foam (Section 3.2). Section 3.3 compares foams of several thicknesses and Section 3.4 compares foams layered in various combinations.
[Note on procedure — all vector values are reported as positive because direction change should be implicit from the context. Also, though "acceleration" is the correct term, "deceleration" will be used at times to emphasize that we are talking about a decreasing acceleration after impact.]
3.1. Effect of Altering Impact Variables in a Self-To-Self Comparison
Introduction — When an object is falling through the air, the main force on the object is the gravitational force and its acceleration downward is g = 9.8 m/s2. If the object strikes a foam surface, or any other surface, then the object rapidly decelerates due to the force of the foam acting upward on the object. The upward force and its duration depends mainly on the stiffness of the foam. If the foam is soft then the upward force will be small, the force will last a relatively long time and the foam will compress by a large amount. If the foam is stiff, then the upward force will be large, the force will act for a relatively short time and the compression of the foam will be small. The upward force and the impact duration also depend on the mass of the object and its impact speed. Typical measurements of such an impacts are presented in Figure 3.
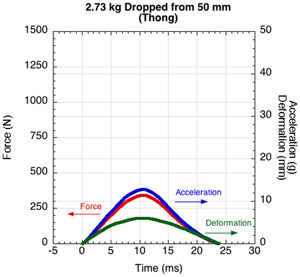
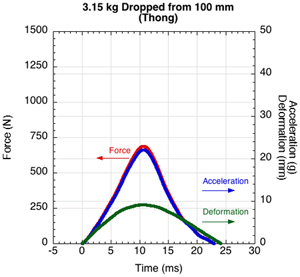
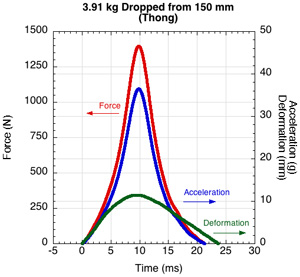
Figure 3 — Oscilloscope tracing of impact force, acceleration and deformation for three masses dropped from different heights: a 2.73 kg mass dropped from 50 mm, a 3.15 kg mass dropped from 100 mm onto a 15 mm thick thong sample and a 3.91 kg mass dropped from 150 mm onto the thong. The axes are the same scale in order to display the comparative difference of the two impacts.
There are two main outcomes that can arise. Either the object bounces up off the foam or it doesn't. Either way, the softer the foam, the smaller is the upward force. If the object doesn't bounce well then the foam can be described as shock absorbing which means that most of the energy of the colliding object is lost in the foam. Cushioning is a different term that refers to the fact that the foam acts to reduce the impact force compared with an impact on a very stiff surface such as concrete. Another common term is "elastic". If the foam is highly elastic then very little energy is lost in the foam when it compresses and the object will bounce well. If the foam is very inelastic then it will be shock absorbing and the object will not bounce well.
The upward force on the object, exerted by the foam, usually starts off at zero, increases to a maximum, and then drops back to zero when the object bounces clear. The maximum force is typically greater than the weight of the object and can even be 100 or 1000 times greater if the surface is very stiff. That very large force, acting for a very short time, will have a similar effect to a much smaller force acting for a much longer time. That is, the object will bounce off the surface at a speed that is typically about half the initial impact speed. The object cannot bounce at a higher speed than the impact speed, since energy is always lost in such a bounce and is never gained.
The upward force exerted by the foam can be expressed in terms of the upward acceleration of the object while it is bouncing. If the upward acceleration is say 10 times the acceleration due to gravity, then the upward force can be described as 10g or 10 g's. The acceleration due to gravity is 9.8 m/s2, but the upward acceleration due to the foam is typically 10 to 100 times larger.
Acceleration
g-force: Figure 4 shows the "g-forces" or "g's" necessary to decelerate various masses to a stop when dropped from 100 mm. The g force refers to the force exerted by the foam on the object, ignoring the gravitational force on the object. However, the g force is not the force itself, but the force divided by the mass of the object to convert to an acceleration. If the object is at rest on the foam then the g force exerted by the foam is 1g. If the object is accelerating upwards at say 9.8 m/s2 then the g force is 2g.
The advantage of using g-force comparisons of accelerations is that they are independent of mass. A 100 kg person and a 50 kg person being accelerated upward at 9.8 m/s2 each experience 2 g's even though the force acting on each is much different. Every little point mass comprising each body will experience the same force, even though one body has more point masses than the other (similarly, stress is defined as force divided by area of application). Acceleration upward compresses a body (as when the drop mass encounters the upward force of the foam), and acceleration downward stretches it. So the compression or stretching on each point mass of each person will be the same at 2 g's. Since force equals mass times acceleration, the actual force on each body will 100 kg x 2 g x 9.8 m/s2 = 1,960 N for the heavier body and 50 kg x 2 g x 9.8 m/s2 = 980 N for the lighter one (remember, 1 g = 9.8 m/s2). Looking at forces alone, one might think that the heavier body would feel the effects of acceleration more than the other, but the g-force method normalizes the comparison independent of mass to show that the effects are the same.
To put the g-forces below in perspective, the human body can endure g-forces of 100 g if applied locally for less than a second but would probably become seriously injured if over 10 g were applied over a much longer time. Damage to a body or object depends on the location of force application, the magnitude and area over which it is applied, the duration, and the structure of the body itself. And in the case of our drop experiments, these all depend on the foam causing the acceleration. G-force acceleration analysis takes all these factors into account for a given object's structure.
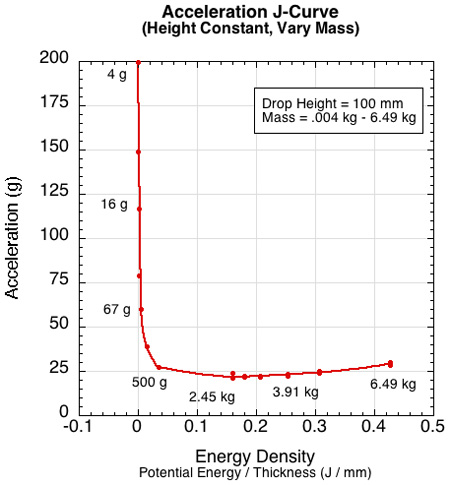
Figure 4 — Effect on peak acceleration by varying the mass (4 g - 6.49 kg) dropped from a height of 100 mm onto the 15 mm thong sample.
J-curves: The type of curve displayed in Figure 4 is known as a J-curve [1]. It is used extensively in the packaging industry to determine the amount of protective foam cushioning a particular item needs. Tests first determine the maximum deceleration a product of a given mass can endure without being damaged. Then, various packing materials are tested at drop heights that the product will experience during shipping. So, according to Figure 4, if your product weighs 67 grams and can endure up to 75 g, then the thong material could be used for cushioning. But if the maximum g's this product can endure is 25 g, then this material is inadequate. Of course adequate packaging is not analyzed by capability alone, but also by weight, volume, and expense, all of which figure into the logistical and financial decisions.
Figure 4 shows only the impact energies and accelerations created by changing the masses dropped from 100 mm. But what if we dropped masses from different heights? We changed impact energies in two ways: (1) holding mass constant and varying height (colored curves) or (2) holding height constant and varying mass (black curves). The interesting result, shown in Figure 5, is that for a given material sample, equal impact energies do not result in equal deceleration behavior. That behavior depends on whether the impact energy is due more to height or to mass (mass-to-height ratio). This means that a heavy person impacting at a slow speed and a light person landing at high speed would experience different cushioning even though the incident impact energies were the same. This is interesting because one might think that a given impact energy would result in the same deceleration behavior for a given material. The reasons why this is not true are a bit divergent from our main topic and are discussed in the Appendix.
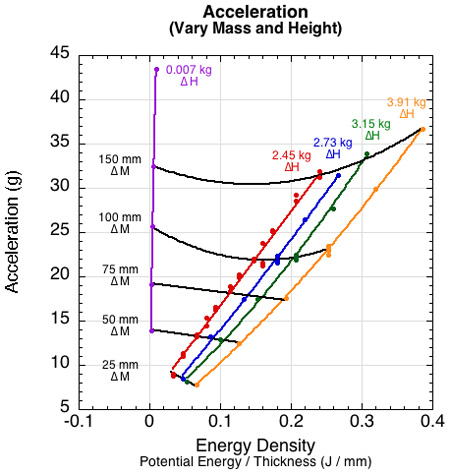
Figure 5 — Impacts with the same energy exhibit different peak decelerations depending on the ratio of drop mass to height (velocity). The black lines show the change in acceleration at each drop height as mass is varied. The colored lines show the acceleration as height is varied for a given mass. At any given impact energy, the least acceleration occurs for the impact with the highest mass-to-height ratio.
Cushioning and g-force reduction: When speaking of footwear, we are in a sense packaging our feet or body to prevent damage. In footwear language, we want to cushion the body against impact. The shoe designer might look at J-curves to choose a material, but players and consumers want an objective method to compare shoes to each other on their cushioning ability. Further, it would be nice if that comparison were measured against some standard factor. To that end we performed all impact tests on a block of cement and compared each material to concrete on all impact parameters. We thus defined cushioning as the percent reduction in deceleration compared to concrete (or, also, the percent reduction in force compared to concrete). Figure 6 shows such a comparison in deceleration for the 15 mm thong compared to concrete over the range of drop heights and masses.
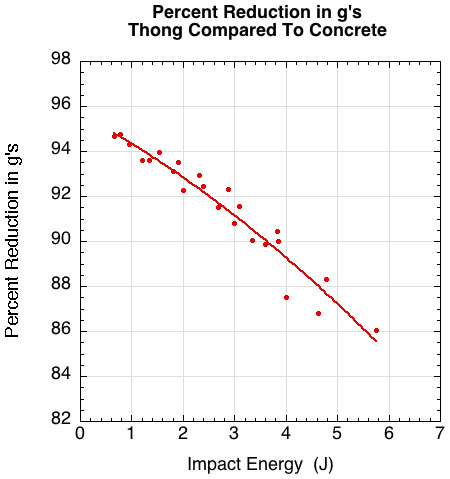
Figure 6 — Percent deceleration reduction as measured in g's of 15 mm thong material compared to concrete.
This collapses the data from Figures 5 and 6 onto one easy to understand curve. As impact energy increases for a given material, the percent of cushioning compared to concrete decreases. This is because higher impact energies increase compression and stiffness — and the thong becomes "more like concrete."
Force — Unlike the acceleration curves in Figure 5, the force arising from changes in mass and height falls nicely onto a single force vs energy density curve. This is shown in Figures 7 and 8. Figure 7 shows the force curve for varying the mass dropped from each height, and Figure 8 shows the curve for varying the height of each mass dropped.
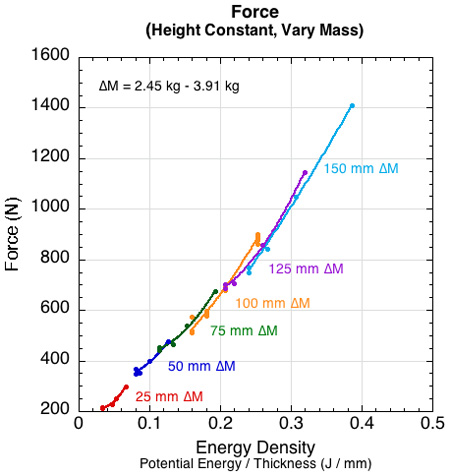
Figure 7 — Peak force as a result of changing impact mass (2.45 - 6.49 kg) and height (20 - 150 mm). Along a given height curve, force increases with mass.
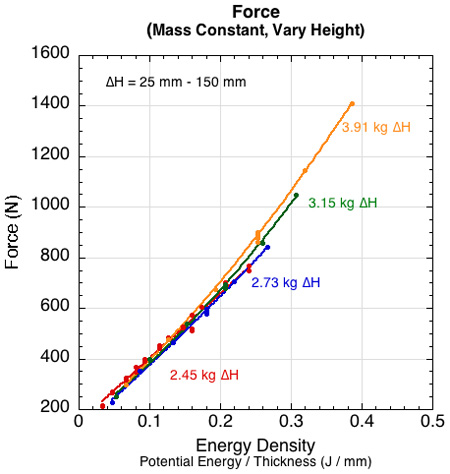
Figure 8 — Peak force as a result of changing drop height (20 - 150 mm) of each impact mass (2.45 - 6.49 kg). Along a given mass curve, force increases with height.
Figure 9 shows the percent force reduction of the 15 mm thong to that of concrete.
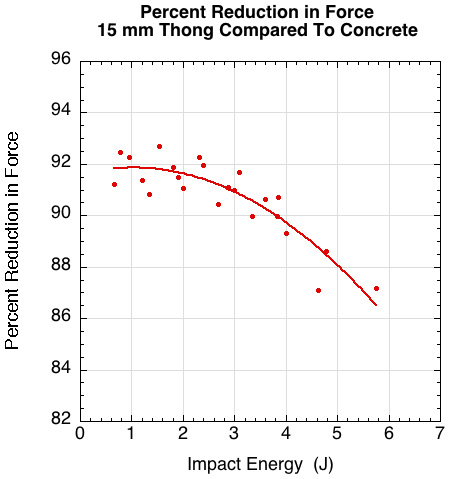
Figure 9 — Percent force reduction for the 15 mm thong vs concrete.
3.2. Comparison of Foam and Thong Material
Introduction — When looking at a single material, the question is whether or not it is appropriate for the activity that it will be used for. We have seen that a material's performance depends on its response to various input variables. That performance is either adequate to the desired activity or not. If it is adequate, the next question is whether it is the best material.
Just as the same foam behaves differently at different impact parameters, different foams perform differently at the same impact parameter — below we compare a 21 mm soft foam to the stiffer 15 mm thong at a constant drop mass of 2.45 kg and varying height from 20-150 mm. These two materials were interesting because they differed in both thickness and material. The foam was soft and compressible when squeezed between one's fingers while the thong was stiff and firm to a similar squeezing. By the standards of everyday "cushiness," the soft foam might seem the best material — thicker and softer.
Comparison graphs — Figures 10-16 show comparisons of the two materials over a range of drop heights (specified on each graph). The drop mass was 2.45 kg. It is usually thought that greater compressibility, slower compression, and lower stiffness indicate more cushioning ability — resulting in lower force and deceleration. These are the properties that one can feel when trying on shoes. If that is the case, certainly the foam appears as the best cushioning material in Figures 10-12.
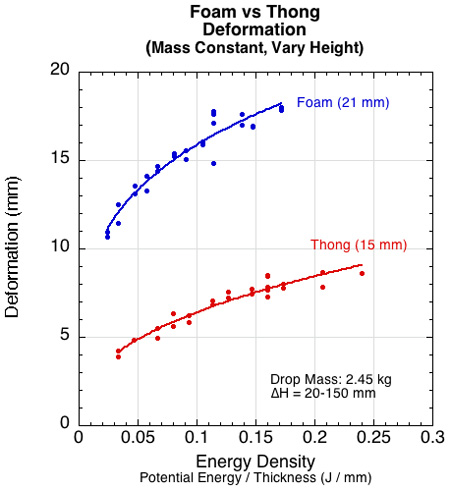
Figure 10 — The thicker foam compresses further and a greater percentage of its thickness than does the thong material.
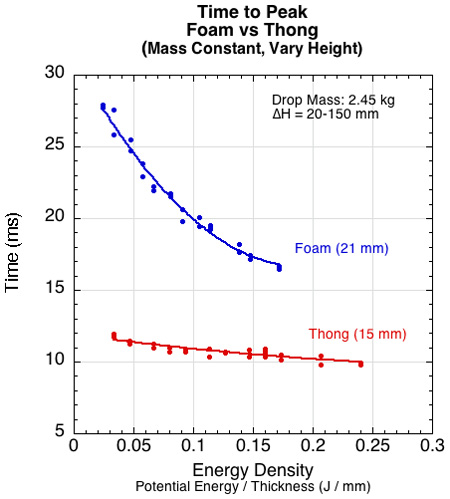
Figure 11 — At all impact masses, the impact duration is longer for the foam than the thong. This is because the foam compresses more and takes longer to do so.
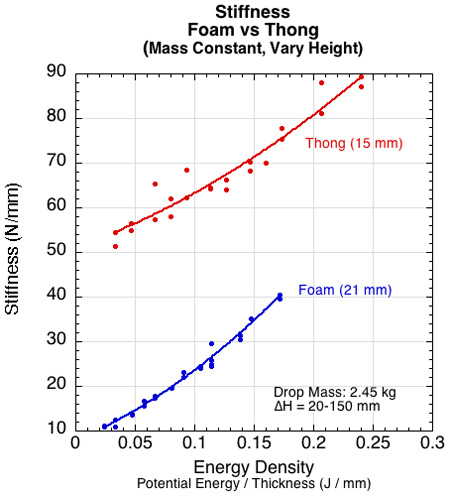
Figure 12 — The average stiffness during compression is greater for all drop heights than for the foam.
But Figures 13-16 tell a different story. The foam is better cushioning at lower impact energies but the thong is better at higher energies.
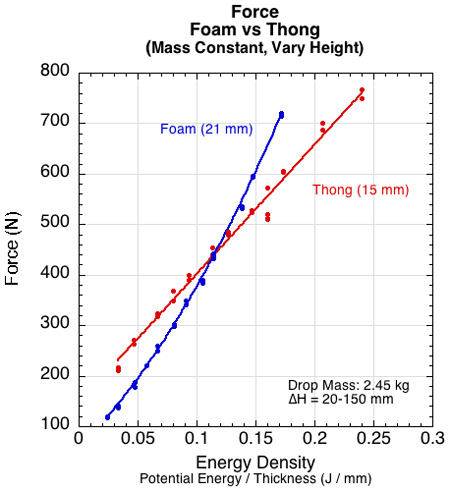
Figure 13 — At lower drop heights, the thong experiences higher forces than the foam, but above about 100 mm the relationship reverses.
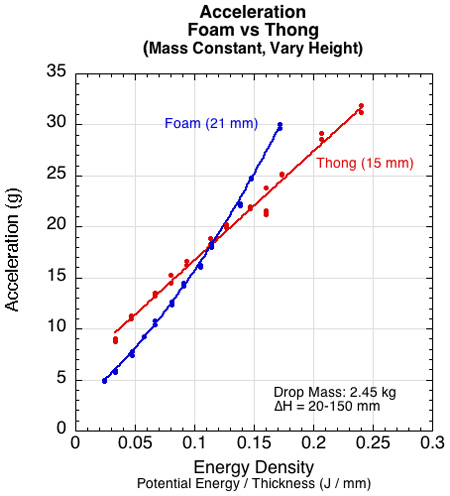
Figure 14 — The deceleration is less for the foam until the energy density is about 0.14 J/mm (occurs with drop height of about 100 mm).
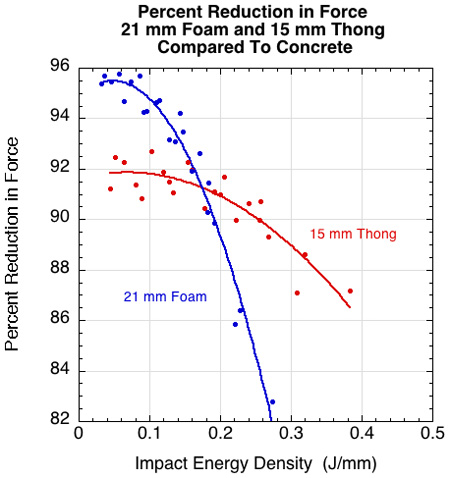
Figure 15 — Percent force reduction of 15 mm thong compared to 21 mm foam.
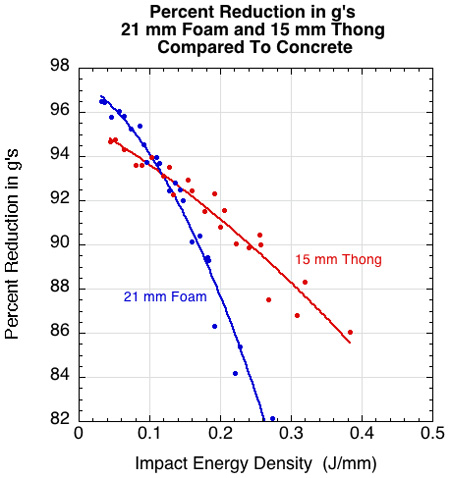
Figure 16 — Percent deceleration reduction of 15 mm thong compared to 21 mm foam.
If you only looked at Figures 10-12 (deformation, time to peak, and stiffness) it might appear that the 21 mm foam was a better cushioning material at all impact energies. But Figures 13-16 indicate that both deceleration and force are greater for the foam than the thong when the impact energy density is greater than 0.14 J/mm. Because it is force and deceleration that cause injury, these are what we are concerned with.
Cushioning behavior is a complicated combination of many factors. That is why it is difficult to tell how well a shoe might cushion simply by squeezing the midsole or lightly bouncing up and down in the store. Activity appropriate energies are required for accurate assessment.
3.3. How Does Thickness Affect Properties?
Often consumers associate heel thickness with cushioning. When comparing shoes the cushioning depends on the amounts and thicknesses of each material used in the shoe. In that case, the materials themselves are probably more important than the sum of their thicknesses. But for a given material, does thickness indicate the degree of cushioning? An interesting question is this: does cushioning continue to increase as thickness increases, or does it plateau or peak out? Is the entire thickness used to decelerate the load or only a part of it? Figure 17 shows 1, 2, and 3 layers of a 26 mm thick foam being impacted by 2.45 kg dropped from 100 mm above the foam surface. This is a different, slightly denser, foam than used in the thong-foam comparison test. The colored horizontal lines indicate the pre-impact positions of the first and third rows of dots on each layer of foam. The colored circles are the corresponding maximum displacements of those rows from their starting positions.
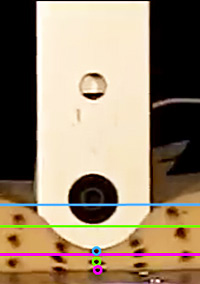
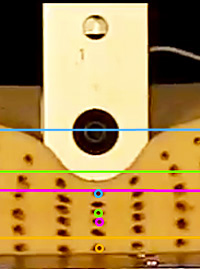
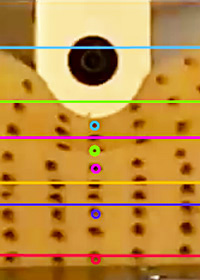
Figure 17 — Deformation by layers of 1, 2, and 3 layers of 26 mm high density foam (total thickness = 26 mm, 52 mm, 78 mm). Lines = dot starting locations; circles = dot location at peak deformation.
As thickness was increased, the impact energy density decreased (less energy per mm of thickness). The energy was absorbed over the entire thickness and each millimeter of material compressed less while more in total were compressed. Thus, deformation increased with thickness. This was true for all drop heights measured (25-150 mm). Each deeper layer compressed less than the one above it and the deepest layer of the 78 mm sample barely deformed. It is reasonable to assume that an effective material thickness is reached when thickness is sufficient such that no deformation takes place at some depth.
We see the same results when comparing two materials of varying thickness to each other. Figure 18 shows the results of two thickness of the thong (15 and 30 mm) and three thicknesses of the soft 21mm-foam (21, 42, and 63 mm).
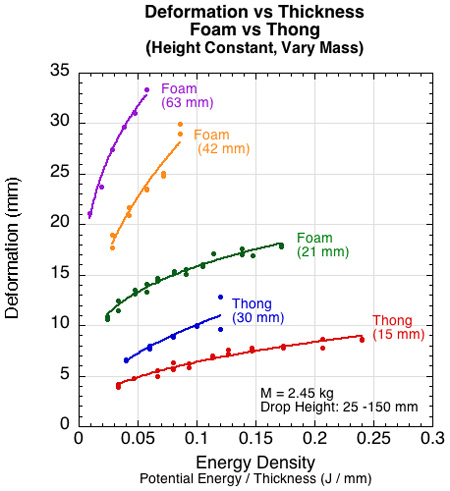
Figure 18 — Deformation for variable material thickness for both the thong and soft foam material. The drop heights (from left to right) for the 21 mm foam and 15 mm thong were 20, 30, 40, 50, 60, 70, 80, 90, 100, 120, 130 and 150 mm. For all the others they were 25, 50, 75, 100, 125, and 150 mm.
Both materials exhibited additional deformation with added thickness and did so at each drop height.
The deformation graph in Figure 18 shows all versions of the foam deforming more than the thong and thicker versions of each material deforming more than thinner versions. The graphs of the forces resulting from these deformations are a bit more complicated. First, Figure 19 shows that for energy density above about 0.14 J/mm the soft 21 mm foam produces more force than the stiffer thong. Second, it shows that all thicknesses of the soft foam produce about the same force at the same energy density values.
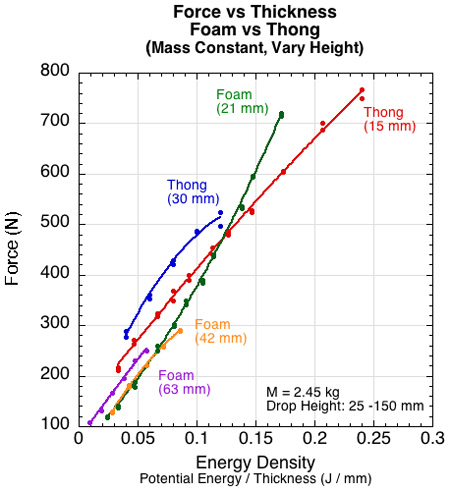
Figure 19 — Force for variable material thickness for the thong and soft foam material.
What this means is that each layer of thickness does not share equally in the impact energy. One consideration is the degree to which a foam is point elastic or area elastic [2]. A point elastic material will only deform beneath the area of the impacting object. An area elastic material will deform radially out from the periphery of the object. An area elastic surface will behave as if it is effectively thicker and softer than a point elastic one.
3.4. Mixed Layers of Foam
Combining layers of different foams into a composite illustrates how foams act differently from each other and how the composite acts differently from its parts. The material, thickness, and location of each layer is important to the final outcome. Figures 20-22 show the results of several combinations of foams. The combinations were made from 5 foams: 6 mm floor mat, 15 mm thong, 16 mm shock-absorbing foam, 21 mm high density foam, 26 mm high density foam, and 75 mm soft, open-celled foam. Variations in each combination were made simply by turning the composite sample up-side-down. Force, acceleration, and deformation were measured for impacts of 2.45 kg dropped from 100 mm. The numbers in the bar graphs refer to the layer's thickness in mm and the letters refer to the layers position — T = top, M = middle, B = bottom. The horizontal axis indicates the total thickness of the sum of the layers.
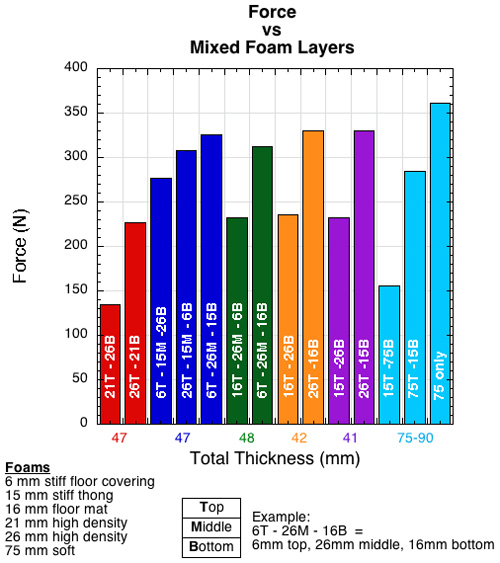
Figure 20 — Force for foams composed of 2 or more layers of materials and thickness. All combinations were tested in up-side-up and up-side-down conditions.
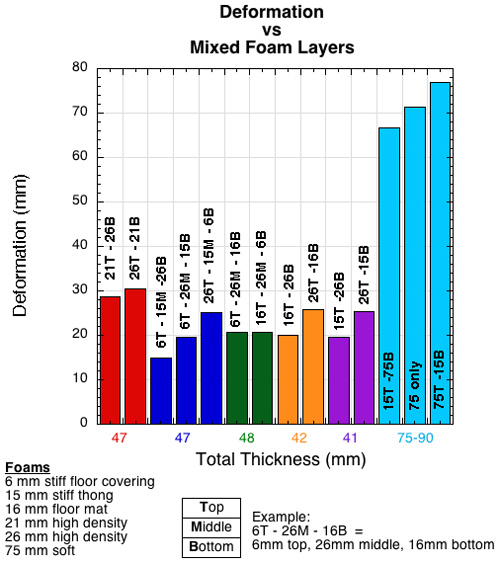
Figure 21 — Deformation for foams composed of 2 or more layers of materials and thickness. All combinations were tested in up-side-up and up-side-down conditions.
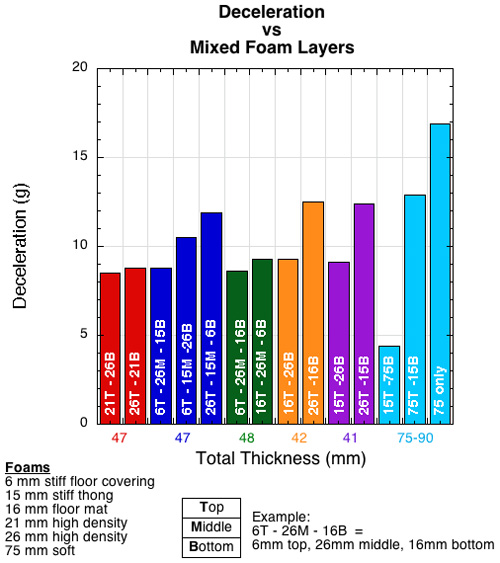
Figure 22 — Deceleration for foams composed of 2 or more layers of materials and thickness. All combinations were tested in up-side-up and up-side-down conditions.
Note that simply turning a sample up-side-down greatly altered the force and deceleration performance, but not as much so for deformation. Perhaps the most interesting result involves the 75 mm foam. It is almost twice as thick as any other combination, yet it produces the greatest force and deceleration, in spite of the fact that it also deforms the most. Yet, in combination with the 15 mm thong, it has the least force and acceleration, even though it compresses a bit less. The reason force and deceleration are so high when the foam is tested by itself is that it is so soft and the deformation so concentrated at a point that it bottoms out. But, in combination with a stiffer thong material on top, the deformation gets spread out over a greater area and prevents bottoming out. Figures 23 and 24 show these relationships.
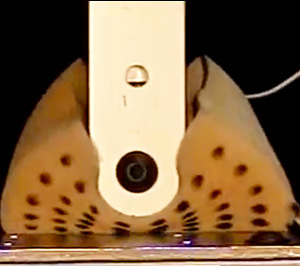
Figure 23 — Peak deformation of soft 75 mm foam. Displays point-elastic behavior.
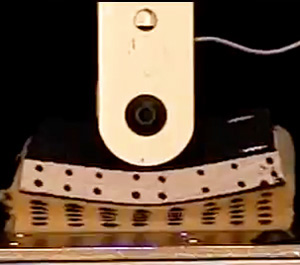
Figure 24 — Peak deformation of the same soft 75 mm foam with stiff 15 mm foam on top. Displays area-elastic behavior. Top layer displays more bending than local compression.
A few more images of material combinations are shown in Figures 25-28.
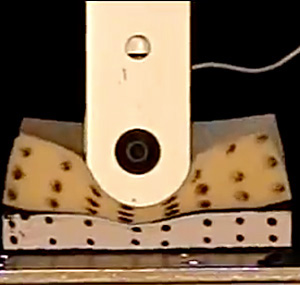
Figure 25 — Peak deformation of 26 mm foam on top and 15 mm thong foam on bottom.
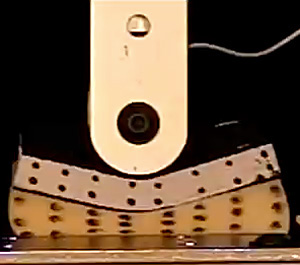
Figure 26 — Up-side-down of Figure 25: Peak deformation of 15 mm foam on top and 26 mm thong foam on bottom.
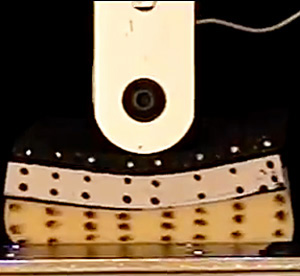
Figure 27 — Peak deformation of 6 mm foam on top, 15 mm foam in middle, and 26 mm thong foam on bottom.
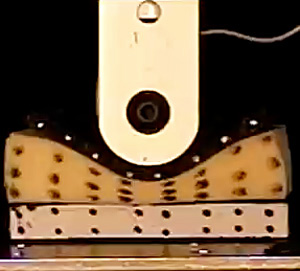
Figure 28 — Peak deformation of 6 mm foam on top, 26 mm foam in middle, and 15 mm thong foam on bottom. Notice virtually no compression of the 15 mm thong on the bottom.
Figures 20-28 all show that material, thickness, location, shape, and combination all influence property performance. Knowing any one of these variables alone (e.g., sole thickness) is not enough by itself to assess the performance and feel of a shoe midsole.
4. CONCLUSION
Testing a shoe's cushioning and comparing it to others can be a straight-forward affair — simply measure and compare. But if you want to know why one shoe is better than the other or whether or not any of them could be better than they are, or if you want to make a shoe from scratch, it becomes much more complicated. The performance of a sole depends on the expected weights of the players and velocities of impact. The cushioning experience will also depend on the ratio of the weight to the velocity. Thickness counts but the material counts more. The thickest material may also be the softest and bottom-out on impact, thus generating much larger deceleration and force.
Thickness, deformation, and time-to-peak can also be misleading. Traditionally, greater thickness leads to greater deformation and longer deceleration durations. But if a material bottoms out, forces and deceleration will spike, even if it took a lot of deformation and time to get to that event.
For any given material sample, the magnitude of the impact energy alone does not determine the reaction of the material. It also depends on the composition of that energy — the mass-to-height (or mass-to-velocity) ratio of the energy inputs makes a big difference.
Not only does the material make a difference, but so does the combination of materials and the order and thicknesses of the layers.
Accounting for all these factors into one's decision making can be onerous. We have used two analysis tools to help consolidate the influence of multiple variables into one parameter. The first was to analyze all cushion events against an independent variable known as energy density, which is the impact energy divided by thickness, thus quantifying the impact as J/mm. The second method was to compare the force and acceleration reduction of the material compared to concrete.
It is also critical to test a material using masses and velocities that are likely to be experienced during use. Making cushioning judgements based simply on "try-on" or casual walking or jumping in the store, or by visual thickness assessments, or even by the manual squeeze test can all be misleading and uninformative. In the end, cushioning depends on what is used, how it is used, where it is used, how much is used, and in combination with what is it used?
5. APPENDIX
5.1. Why does force and deceleration depend on the mass/height ratio of the impacting device?
As mentioned above, it is tempting to think that at a given impact energy the peak deceleration would be the same no matter the combination of mass and velocity that makes up the energy. But, as we saw in Figure 5, the actual behavior depends on the ratio of mass-to-height. Because the impact energy is constant along any vertical line from the horizontal axis, the product of mass times height must also be the constant (from Equation 1). If m is increased, h must decrease, and if m is decreased, h must increase. So the values at any impact energy will depend on the ratio m / h. If you increase m and decrease h, the ratio increases, and if you decrease m and increase h, the ratio decreases. In Figure 6, at any given energy, the heavier mass with the lower velocity will display lower peak deceleration than lighter masses or higher velocities.
Why does the relative proportion of mass and height (velocity) comprising the energy make a difference? Why does an increase in mass impact energy have a lower deceleration than an equal increase in height induced impact energy. The reason for this is evident if we look at the equations for force and energy. The decelerating force is given by
(2) F = ma = m dv/dt
where F = force, m = mass, and a = acceleration (deceleration).
Rearranging Equation 2 we see that deceleration is inversely proportional to mass
(3) dv/dt = a = F / m
Increasing mass decreases deceleration and decreasing mass increases deceleration. That answers part of the question.
During the drop, impact, and deceleration events, energy is transformed from potential energy to kinetic energy to work energy. These equations are given by
(4) PE = mgh
(5) KE = .5mv2
(6) W = ∫F dx = kx2 / 2
where PE is potential energy, m is mass, g is gravitational acceleration (9.81 m/s2), h is height, KE is the kinetic energy at the instant of impact, v is the velocity at impact, W is work, F is the force on the object, x the foam deformation, and k the stiffness coefficient of the foam. Potential energy just before dropping is equal to kinetic energy just before impact which is equal to work energy at total deceleration (PE = KE = W).
Equating Eq. 4 and 5 we find that impact velocity is proportional to height.
(7) v = √2gh
Increasing drop height increases impact velocity which is the velocity that must then be decelerated to zero. Since deceleration is change in velocity over time, we find that average deceleration over the entire deceleration time interval is
(8) a = √2gh / t
where t is the time from impact to peak deformation, where v = 0. And that answers the other half of our question. In sum, increasing mass decreases deceleration (Equation 3), whereas increasing height (velocity) increases it (Equation 8).
For the most part, this is what we see in Figure 6. But if it is true that increasing mass decreases deceleration, why does deceleration start to increase with increasing mass for the J-curves? The reason is that deceleration also depends on material stiffness. As the foam compresses, it becomes stiffer. And the faster it does so (the strain-rate), the stiffer it becomes. Equations 8-10 describe how deformation depends on stiffness and deceleration depends on both.
Solving for F by combining Eq. 4 and 6 we see that
(9) F = mgh / x
And from Equations 3 and 9
(10) a = gh / x
Finally, Equations 4 and 6 tell us that
(11) x2 = 2mgh / k
So x, the deformation, depends inversely on k, the stiffness, and directly on mass and height (Equation 11), and a (deceleration) depends inversely on x and directly on height (Equation 10). So, a larger k (stiffer) leads to smaller x (less deformation) which leads to larger a.
Equations 2-11 show how deceleration depends on drop height, drop mass, deformation, and stiffness and this reflects the graphs in Figures 5 and 6. If we know the likely impact energy, the mass and height composing that energy, and the magnitude of deceleration we are willing to accept, then we could determine whether particular material and thickness is suitable to the job from a graph like Figure 6.
But given the dependence of acceleration on drop height, mass, deformation, stiffness and the ratio of mass to height, we can go one step further and combine all these factors into one independent x-axis parameter. This results in a much simpler, more elegant, mathematically appealing graph at the expense of a conceptually difficult independent variable created as shown in Equation 12. We do this by plotting acceleration vs stiffness (k) x potential drop energy (mgh) divided by thickness times the mass-to-height ratio:
(12) Energy composition density = kmgh /T(m/h) = kgh2/T
where k is the stiffness, mgh the potential drop energy, T the material thickness and m/h is the mass-to-height ratio.
Because this method of collapsing the acceleration curves onto one curve by dividing the energy term by both the foam thickness and the ratio of the energy inputs, the result can be thought of as an "energy composition density." In terms of units, this term reduces to Nm/s2, which can be read as energy per second per second or as power per second. Figure 29 shows the result.
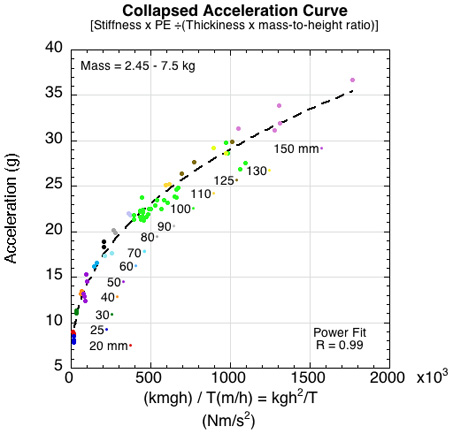
Figure 29 — The acceleration curves from Figures 5 and 6 resulting from changes in drop mass and height are combined onto one curve. The graph plots acceleration vs stiffness x potential drop energy divided by thickness times the mass-to-height ratio. The single curve represents all impact energies resulting from altering combinations of drop mass and height.
As we have seen, it is the makeup of the energy as well as the thickness of the foam that is as important as its magnitude, and Figure 29 captures all of this in one predicative curve. According to the graph, if your maximum acceptable acceleration was 20 g, then any mass between 2.45 and 7.5 kg dropped from 70 mm or less would produce impact energies that could acceptably be decelerated.
References
1. Frankovich, D. Proper performance data ease the task of specifying cushioning materials. Retrieved from http://www.trelleborg.com/Documents/Trelleborg Applied Technology/CONFOR-Foam-Specifying-Cushioning-Materials.pdf, accessed 5-30-2017.
2. Nigg, B.M. & Yeadon, M.R. (1987). Biomechanical aspects of playing surfaces. Journal of Sports Sciences 5, 117-145.