INTRODUCTION
How String Pattern Affects Spin
Spin is an essential part of today's game of tennis. Racquet and string advertising proclaim the spin benefits of particular products and players agonize over which racquet-string setup will generate the most spin. But how do you choose? What factors really matter to spinning a tennis ball? Why do they matter? How do you maximize the effect of those causal factors?
Studying spin is difficult because it depends on many factors. Among these are the incident spin, speed, and angle of the ball; the speed, angle, and tilt of the racquet; the string material and properties such as energy return, stiffness, coefficient of friction, and tension; and the string pattern and spacing. To examine the effect of changing any one of these, you have to control for all the others because even small changes (especially incident spin, speed, and angle) can make large differences in spin. If you don't control for all these factors, then you can't confidently attribute causality to any particular phenomenon of interest.
The primary interests of this study were the effect on spin and rebound angle of changing string pattern and material. More specifically, we studied the difference in spin between polyester and nylon and between four different string patterns: 16x19, 16x15, 16x16 diagonal strings, and 2 faux Spaghetti stringing patterns (non-interlaced strings) — (1) a 2-plane pattern with mains on one side and crosses on the other and (2) a 3-plane stringbed with crosses sandwiched between 2 planes of mains. Spaghetti stringing has been banned by the ITF, but we studied it to show in the extreme what is occurring to a less degree in normal interlaced stringbeds.
Throughout, we employ several simplifying assumptions. Unless otherwise specified, we usually consider the racquet to be at rest. The physics is the same whether the ball hits the racquet, the racquet hits the ball, or they both hit each other. Secondly, though every force has an equal and opposite force, we will focus mostly on the forces affecting the ball. And last, though velocities, spins and forces are vector quantities requiring a positive or negative coefficient, we will usually use all positive numbers and simply indicate whether they should be added or subtracted. But mostly, we try to avoid math altogether! However, there is a "Mathematical Analysis" section in the Appendix.
The presentation is in five parts. Part 1, "Forces Influencing Spin", introduces many of the concepts necessary to understand the results of Part 2, "The Experiment". Part 3 is a "Discussion", Part 4 is the "Conclusion", and Part 5 is the "Appendix".
PART 1: FORCES INFLUENCING SPIN
Spin is essentially the result of three forces: friction, elastic, and normal (perpendicular to stringbed). These can combine to maximize or minimize spin. In general, friction and elastic forces will increase spin and the normal force will decrease spin, because it usually is directed toward one side (the "wrong" side) of the ball. Friction is present in every impact and the spin-relevant elastic forces occur primarily when the main strings are moved sideways. The asymmetric normal force is present on all non-perpendicular impacts or those that have incident spin, but its effect is greatly magnified when the main strings move sideways. This movement, in turn, is influenced by string materials and patterns.
1A. Friction Forces and Spin
As shown in Figure 1, the path of a tennis ball flying at an angle relative to the stringbed can be divided into two paths, one perpendicular and the other parallel to the stringbed. That's because the ball is traveling in both directions at once.
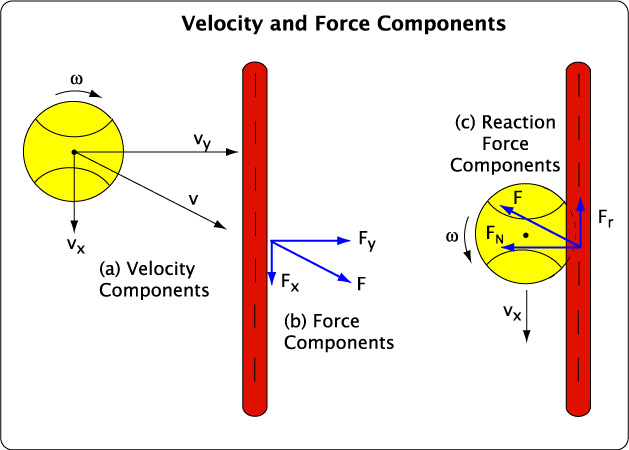
Figure 1 — Velocity and Force Components. (a)Velocity components at impact. (b) Force components of ball on racquet. (c) Reaction force components of racquet on ball. For reasons discussed below, the normal force is typically directed in front of the ball's center of mass. This offset in FN acts to reduce the outgoing spin while the friction force Fr acts to increase the outgoing spin.
Similarly, when the ball and racquet collide, there is only one net impact force, but this can be divided into a perpendicular and parallel component. The perpendicular forces are known as normal forces (Fn) and the forces parallel to the stringbed are friction forces (Fr). Friction resists the relative motion of two surfaces in contact. It acts to resist the initiation of movement between the surfaces or to retard and extinguish any motion that does occur.
The normal reaction force pushes the ball off the strings and is responsible for the racquet's power. Friction influences the rebound angle by slowing the ball's tangential speed as it slides across the stringbed (vx), and it changes the speed and direction of the spin (ω) by exerting a rotational torque on the contacting surface of the ball. This frictional force against the sliding continues until the rotational and linear speeds of the contact point are equal but in opposite directions. When this occurs, the speed at the contact point is zero. If there is no relative motion between the two surfaces, then there is very little friction or torque and very little additional change in spin or velocity parallel to the stringbed. When this occurs, the ball is the rolling mode. Even when rolling or biting, however, static friction remains, and this will act opposite the direction the contact point is trying to move. It can switch back and forth between facilitating or inhibiting topspin. As such, this force tends to cancel itself out.
The low-friction state occurs for impact angles less than about 50 degrees to the perpendicular. At higher angles the ball will slide throughout its bounce and never achieve the rolling, low-friction condition.
1B. Elastic Forces and Spin
Sideways Main String Movement. If, during impact, the ball pushes the main strings sideways, storing elastic energy, that energy will be returned to the ball when the strings snap back. Sideways elastic energy is stored in both the strings and the ball. The ball is deformed tangentially to its movement even if the strings don't move. The compressed energy in the ball will push sideways off the strings and add spin. But the contribution of the ball's sideways compression is very small compared to that of the strings sideways dislocation. The basic effect of string movement on spin is demonstrated in Figure 2.
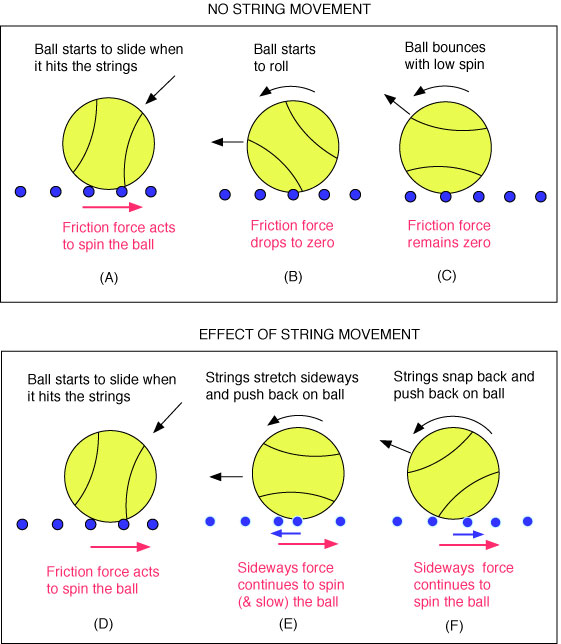
Figure 2 — String movement and snap-back. Lateral string movement stores elastic energy which is used to spin the ball when the strings snap back.
The actual movement of the string will be diagonal, as seen in Figure 3. You can see the normal and tangent components in reference to the undeformed stringbed, as indicated by the empty circles on the left, squashed ball image. The ball deforms between the strings such that the tangent force is pushing against a gear-like protrusion. This force slows the ball and increases spin. It does so both as the string is being stretched and when it snaps back.
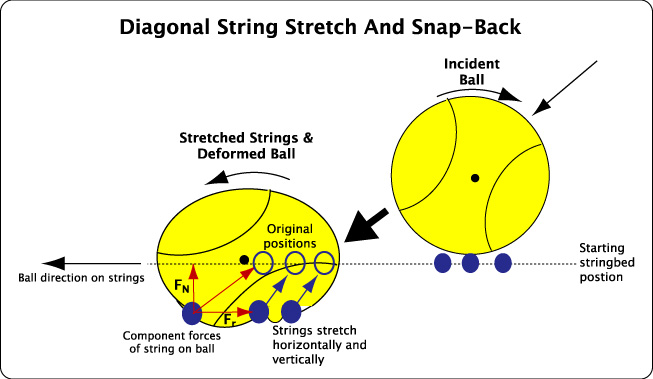
Figure 3 — Diagonal stretch. This two-dimensional view shows that lateral string movement causes the string to stretch diagonally such that when it snaps back, it will both add spin and push the ball backwards, causing a higher launch angle from the racquet. As shown, some strings may move further laterally than others, causing ball protrusions between the strings.
1C. Perpendicular Forces and Spin
The perpendicular rebound force usually does not act directly through the center of mass, but rather, in front of it. This happens whether or not the strings move laterally. That is because the ball starts to spin off of the strings on its back side and into the strings in front. The ball thus exerts greater force on the strings on its leading side. Friction slows the bottom half of the ball, causing the upper half to stretch and deform forward, shifting weight as it does so. The greater force on the strings at the front of the ball causes the net normal force to shift forward in front of the CM by a distance D — usually about 2-9 mm, depending on the stringbed setup. This distance, D, is often used to designate the normal force offset as "D-offset." To determine the value of D-offset, solve Equation 6 in the Appendix for "D". Figure 4 demonstrates this process.
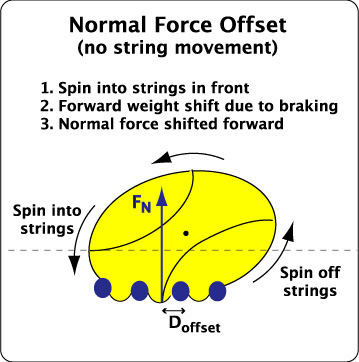
Figure 4 — Normal Force Offset ("D-offset"). The ball spins out of the strings in back and into the strings in front. The braking motion of friction causes the top half of the ball to stretch forward as momentum shifts weight forward. The combination of spin and braking moves the net normal reaction force (the sum of all the individual forces) in front of the center of mass by an amount D. A similar thing happens when the brakes are applied in a vehicle. Weight shifts forward since the front end of the vehicle rotates down towards the road, increasing the force on the front wheels.
This normal force offset is increased if the the main strings move laterally during impact. That is because the strings also move to the front of ball, skewing the normal force even more forward, as shown in Figure 5.
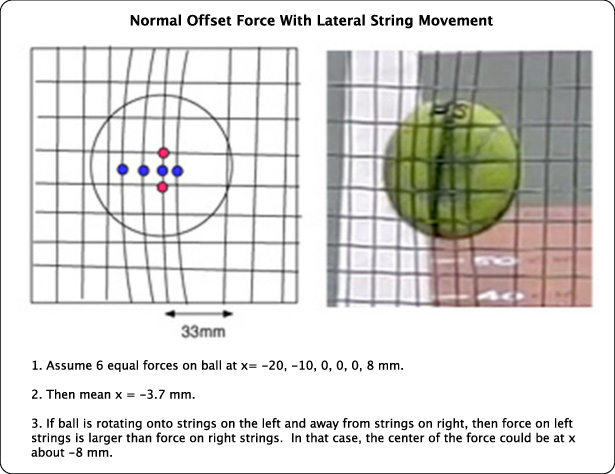
Figure 5 — Normal Force Offset with string movement. String movement to the left combined with spin into the strings on that side combine to move the normal force further in front of ball. The 33 mm indicates the radius of the ball.
Being an off-center force, the normal force creates a torque equal to the normal force times D: (FN x D). This torque is in the opposite direction of that caused by friction and string snap-back. The greater is D, the greater will be this counter-spin force. So, lateral string movement tends to increase spin due to added elastic and friction forces but simultaneously limits the increase in proportion to the amount of offset, some of which is caused by string movement itself.
An effective way to visualize the effects of string pattern on the normal offset is to view impacts from the side. Figure 6 shows ball-string interaction at maximum impact for balls fired at about 52 mph at 35 degrees.
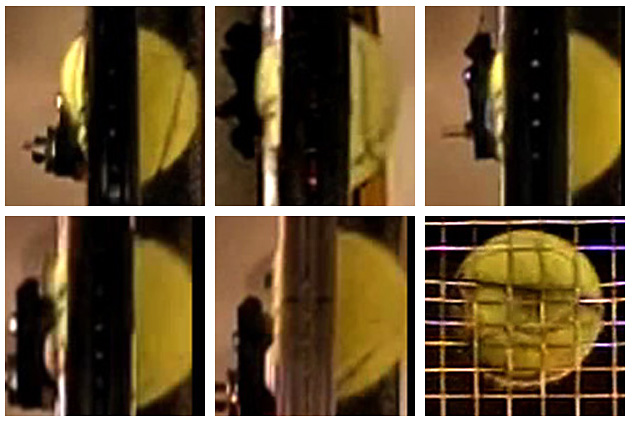
Figure 6 — Normal Force Offset as seen from side (filmed at 1200 fps) From top left to right: 14x9 pattern, 16x15 Steam 105S, 16x15 Steam 99S, 16x19 Steam 106, 18x20 Prestige, close-up of a 16x15 ball "protrusion" from behind. Notice the progressive decrease in ball protrusion as the pattern gets denser. For the open patterns, as the strings move forward they leave a space for the ball to drop into. There is little perpendicular force pushing back here (it has all moved forward), but there is a big protrusion for the strings to push laterally back against. It is easy to visualize how the strings will increase spin and push the ball backwards and upwards upon rebound in the open patterns. The denser patterns demonstrate less or no movement and crush the ball into a flatter, more even pancake.
1D. Perpendicular and Tangential "Power"
Energy return is measured perpendicular (known as ACOR) and tangential (known as eT) to the stringbed . ACOR is the ratio of the perpendicular rebound speed to the incident speed: ACOR = Vy2 / Vy1. eT is the ratio of rebound contact point speed to the incident contact point speed: eT = - Vc2 / Vc1.
ACOR is a measure of the energy given back to the ball in the perpendicular direction and eT is a measure of the energy given back in the tangential direction. For eT, most of the energy given back is the result of turning linear speed into spin speed. Whereas ACOR is typically between 0.15-0.55, depending on the hitting location, eT is in the range of -0.1-0.1 in normal racquets but as much as 0.3 with spaghetti racquets. These relationships are illustrated in Figures 7, 8 and 9.
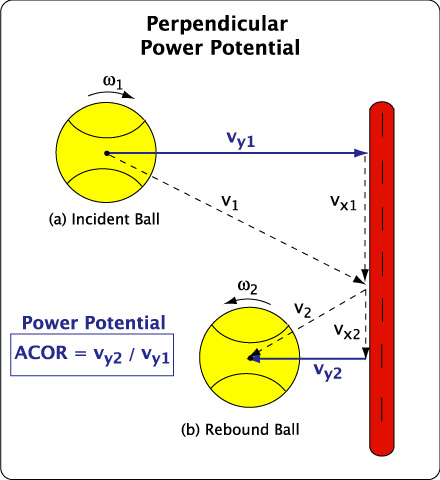
Figure 7 — Power Potential (ACOR) The so-called "power" of the racquet is measured by ACOR = vy2/vy1
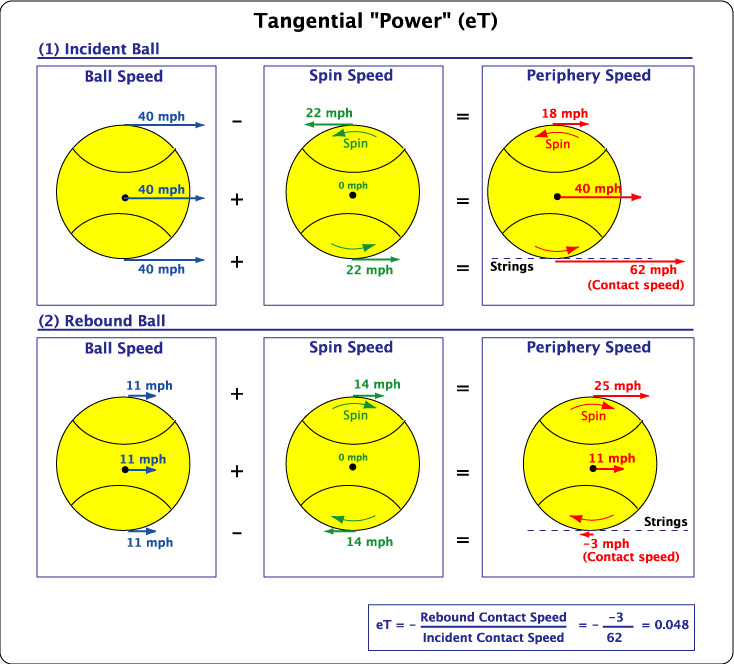
Figure 8 — Tangential Energy Return. eT can be positive, negative or zero. If it is negative, the ball slides throughout the impact and spin will be minimal; if it is positive, bite occurs and there is probably some string snap-back resulting in more spin; if zero, then the ball rolls with spin speed equal to the ball speed parallel to the stringbed. In the example above, the incident and rebound ball speeds would correspond to the Vx1 and Vx2 lines in Figure 7. The incident spin would be a backspin of -2900 rpm and the rebound spin would be topspin of 1765 rpm.
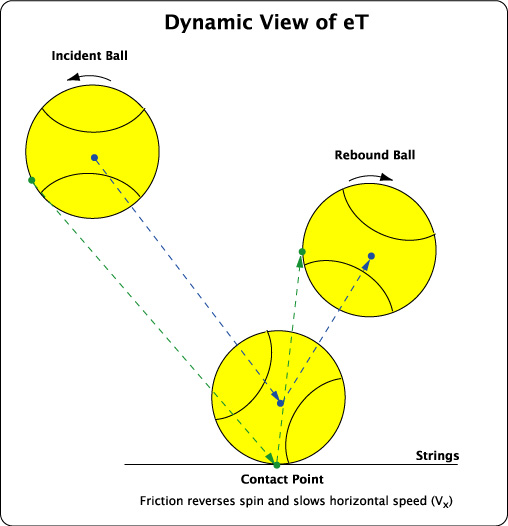
Figure 9 — Dynamic View of Tangential Energy Return.
We will see in the experiment that eT and D play a large role in determining the difference in spin between string materials and patterns. It is therefore essential to have some familiarity and comfort with their definition and meaning.
PART 2: THE EXPERIMENT
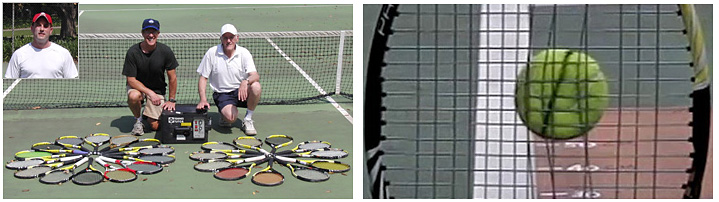
2A. The Setup
The test setup is shown in Figure 10. New balls were fired from a ball machine at about 63 mph and at an angle of about 40° away from the perpendicular to the string plane. The balls were incident with backspin at about 2900 rpm onto a hand-held racquet which was held so that the ball would push the main strings sideways within the string plane. The racquet was held still rather than swinging it at the ball. That way, there was no variation in racquet speed. It was zero for every shot. We say "about" here because the balls came out of the ball machine with small variations in speed, spin and angle. To overcome that problem, we measured the speed, spin and angle of every ball fired by the ball machine and then adjusted the measured outgoing spin by an amount that corrected for these small variations in the incoming ball. A high speed camera (300 fps) was mounted on a tripod looking vertically down onto the court to measure the ball speed and spin. A second high speed camera (600 fps) was mounted several feet behind the strings to measure string movement and to measure the impact point of the ball on the strings. Measurements were made from the scale on the court and adjusted by a calibration factor determined by filming the scale at the height of the ball impacts.
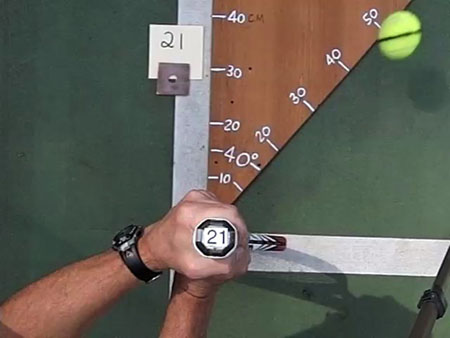
Figure 10 — Experiment setup to measure the spin off a hand-held racquet. The racquet was held in a vertical position with the head resting lightly on the court. The ball was fired at 63 mph at a 40 degree angle with backspin of -2900 rpm to strike points near the middle of the strings.
For most of the tests we used the same racquet (Wilson Pro Open, 100 sq.in. headsize) and same stringing system (16 Mains x 19 Cross) and the same string tension (52 lb). We used 22 nominally identical racquets all strung with different strings. However, two of these racquets were strung with a "faux" version of the spaghetti system, as shown in Figure 11. One was strung by not weaving the mains and crosses so we ended up with two planes of strings at right angles to each other. The mains could all slide freely and independently across the cross strings. Exactly which mains moved depended on where the ball struck the racquet. We tested each side as a separate string pattern (2-plane spaghetti mains and 2-plane spaghetti crosses). The other racquet was strung with three planes of strings with half the mains on one side of the crosses and the other mains alternating on the opposite side (3-plane spaghetti). The second system is more like the original spaghetti design in that the ball can strike main strings on both sides of the racquet. In the original spaghetti system, the mains on each plane were all tied together with twine so that they all moved in unison, more efficiently storing and returning energy. There were only 6 crosses and 14 mains and the mains were threaded through tube-like rollers at each intersection with the crosses.
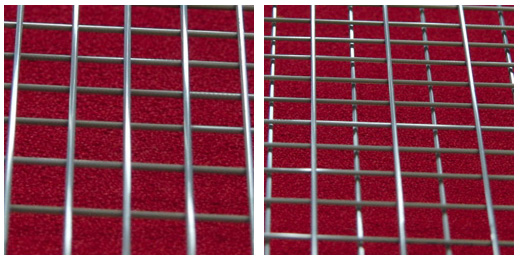
Figure 11 — Spaghetti String Patterns. Left: 2-plane pattern, spacing (MxX) = 10 x 11.3 mm; Right: 3-plane pattern, spacing (MxX) = 20 x 11.3 mm.
The other patterns are shown in Figure 12. Spacing was measured over a 3x3 grid area in the middle of the racquet to determine average spacing between the mains and the crosses in the hitting area. With the diagonal pattern, the measurement was from corner to corner, since that is the direction the ball meets the strings.
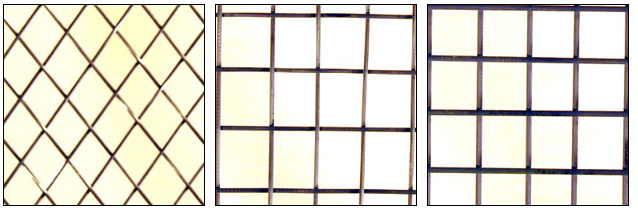
Figure 12 — Other String Patterns. From left to right: PowerAngle Pro 16 x 16 diagonal pattern, spacing (corner to corner) = 16.6 x 22.5mm; Wilson Steam 105S 16 x 15 pattern, spacing (MxX) =11.7 x 15.2 mm; Wilson Pro Open 16 x 19 pattern (the standard racquet used), spacing (MxX) =10 x 11.3 mm. Not pictured, Wilson Steam 99S 16 x 15 pattern, spacing (MxX) = 10.4 x 14.7 mm.
2B. Results
2B-1. Average Overall Spin and Rebound Angle Results. Spin and rebound angle were our primary performance parameters of interest. Figure 13 shows the summarized average spin and rebound angle results for each group of string materials and string patterns (if you multiply the spin in rad/s by 10 you will be very close to the spin in rpm). It is clear from the figure that spaghetti patterns (except the spaghetti crosses-only side) had the most spin. The 16x15 Steam racquets were next, with about 10% more spin than the 16x19 polyesters and the Steams at 62 lb, but still 11% less than the spaghetti patterns. For the 19 16x19 racquets, polyester averaged only 4-5% more spin than the nylons.
For rebound angle, the spaghetti mains racquets (mains only side of 2-plane, 3-plane at 52 and 62 lb) had the lowest angle to the perpendicular (highest launch angle). The 16x15 Steams and 16x16 diagonal were next. The 16x19 patterns were all about the same (nylon, smooth and shaped polyester, and 2-plane spaghetti crosses), except the Zyex string which had the lowest launch angle of all.
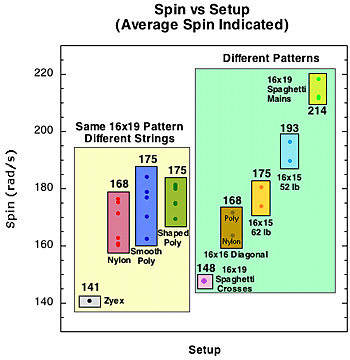
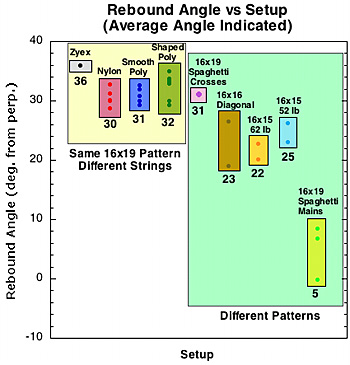
Figure 13 — Average spin and rebound angle by string material and pattern. Normalized incident parameters: v=28 m/s (63 mph), angle= 40 degrees, spin = -2900 rpm
Given this large difference in spin and rebound angle between the setups, we will examine some of the parameters responsible for influencing these. The parameters of most interest are tangential coefficient of restitution (eT), normal force offset (D-offset), and spin number (SN, defined below as eT*R/D) and COF Spin Potential (Ball COF / String COF).
2B-2. SPIN VS SPIN PARAMETERS. One of the most interesting findings of this study is the relationship of D-offset and eT and of both to spin. As patterns become more open and allow more string movement, both eT and D-offset increase, as seen in Figure 14. But eT and D-offset are competing forces in the spin war — eT increases spin and D-offset inhibits it. As we jump from 16x19 to 16x15 to spaghetti patterns it seems that the increase in spin due to eT more than offsets the decrease in spin due to the increase in D-offset. Figure 15 shows the relationship of spin to eT and D.
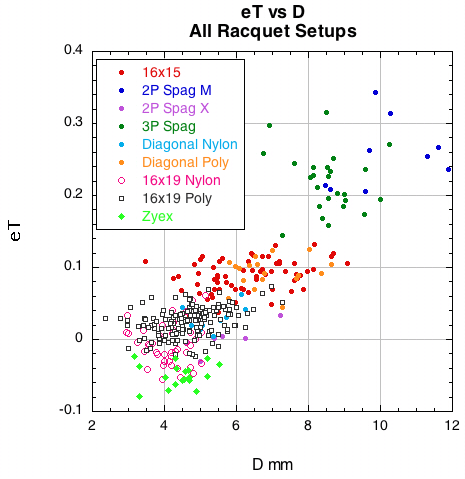
Figure 14 — eT vs D for all racquet setups. As patterns get more open and allow more string movement, both eT and D-offset increase. Large D-offset inhibits spin but large eT increases it. For the more open patterns, eT seems to win the spin war, increasing spin in spite of increased D-offset.
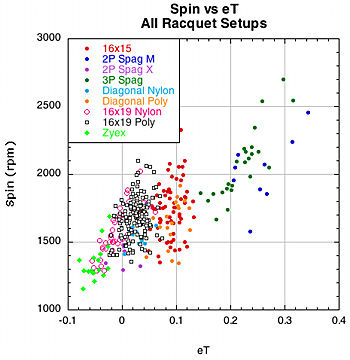
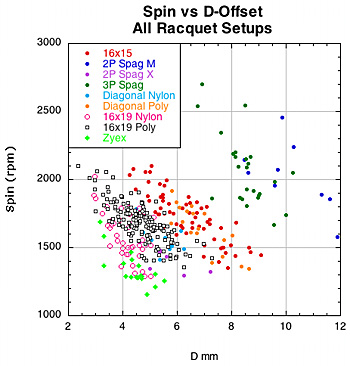
Figure 15 — Spin vs eT and D for all racquet setups. As you move to more open patterns spin goes up more with eT than it is inhibited by D-offset. However, within each setup group, you can see that spin tends to decrease with increased D-offset and increase with larger eT.
As is apparent from Figure 15, for each setup group spin tends to increase within the group for eT and decrease with D-offset. But jumping from setup group to setup group in the direction of more and more open patterns leads to more spin. The behavior seen in the spin vs D-offset graph is particularly strange. Within each setup group spin decreases as D increases, but it increases across setup groups towards open patterns and even larger D-offset. So, if eT and D both increase together and spin increases with eT and decreases with D, then spin increases and decreases at the same time. Obviously the relationship between eT, D-offset and spin is a bit more complicated. Spin depends on how much eT and D-offset change compared to each other. To make the relationship more apparent, we need a way to examine the simultaneous relationship of eT and D on each other and on spin. To do this we use a new parameter we call the Spin Number (SN):
Spin Number = eT*R/D.
This is a dimensionless number where R is the radius of the ball and D is the normal force offset.
Graphing the spin against the spin number yields some interesting results. This is shown in Figure 16.
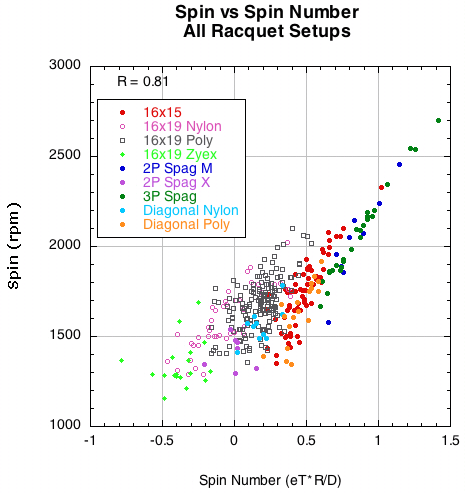
Figure 16 — Spin vs Spin Number for all racquet setups.
The more open the pattern, the stronger the correlation of spin to spin number. The paradox in Figure 15 of spin increasing as D-offset increases between patterns but decreases within a pattern is solved. What is important is how eT and D-offset change relative to each other. Spin number reveals the dynamic relationship of eT, D, and spin, both within and between racquet setup groups.
Further graphs and images of Spin Number, D-offset and eT relationships can be seen in the Appendix.
Polyester generally produces more spin than nylon or gut and polyesters differ between each other in spin production. One of the main causes for this difference is the coefficient of friction (COF) of each string. A polyester string can be considered a "string movement setup" compared to other materials. We measure two COFs in the TWU lab — ball-to-string COF and string-to-string COF. The ideal is to have a high ball COF so the string and ball will stick together, and a low string COF so the strings will slide freely on each other. The ratio of ball COF to string COF is called the Spin Potential (SP). A high SP should produce more spin, all other things being equal (which they never are). Figure 17 shows graphs of spin vs spin potential and spin number vs spin potential.
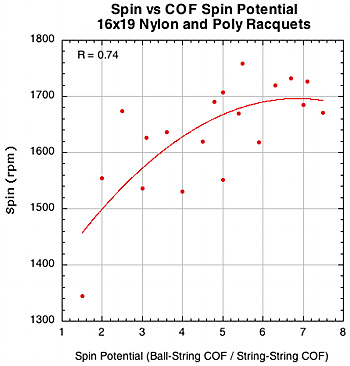
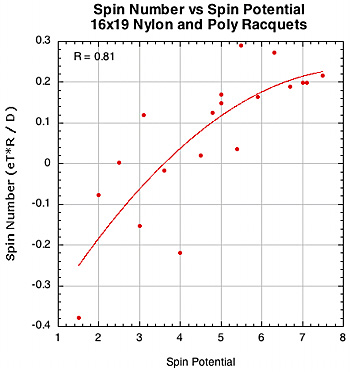
Figure 17 — Spin vs COF Spin Potential and Spin Number vs COF Spin Potential for 16x19 nylon and polyester setups.
2B-3. REBOUND ANGLE VS SPIN PARAMETERS. Figure 18 shows that rebound angle is very strongly related to both D-offset and eT. As each increases, the rebound angle decreases and is closer to the perpendicular of the stringbed. That means a higher launch angle on the court.
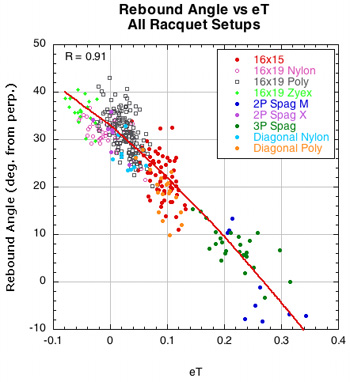
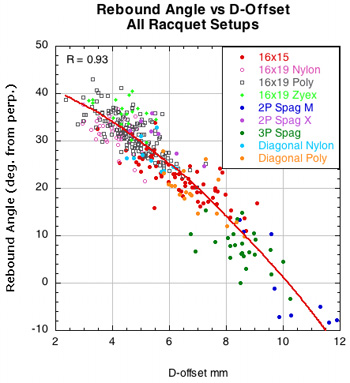
Figure 18 — Rebound angle vs eT and D-offset for all racquet setups.
A player wants to know how spin and rebound angle are related. Most players believe that more spin will mean a higher launch angle. Figure 19 graphs rebound angle vs spin for all the racquet setups. The relationship is not very strong but it suggests that as spin increases so will launch angle (low angle to perpendicular).
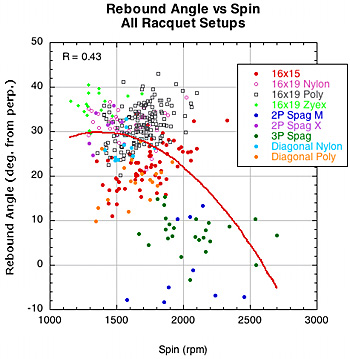
Figure 19 — Rebound angle vs spin for all racquet setups.
The reason for the low correlation of spin and rebound angle is as follows. As seen in Figure 15, high eT correlates to high spin within and between setups and high D-offset correlates to low spin within a setup group. We end up with same paradox as we had with spin. Rebound angle decreases with both eT and D but spin increases with eT and decreases with D. So, the unacceptable conclusion follows that spin both increases and decreases as rebound angle decreases. Again, the reality depends more on how eT and D change relative to each other and how spin and angle change as a result. The two graphs in Figure 20 show, first, rebound angle vs spin number, and, second, both spin and angle plotted against spin number. The second graph shows that as spin number increases, both spin and launch angle increase (i.e., lower angle perpendicular to stringbed).
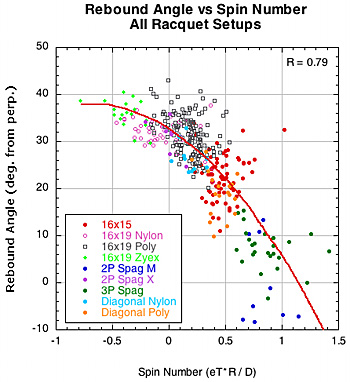
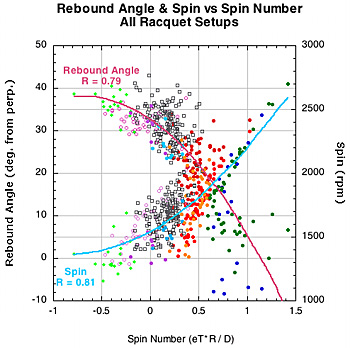
Figure 20 — Rebound angle vs spin number and both angle and spin vs spin number for all racquet setups.
More rebound angle graphs of all setups can be found in the Appendix.
2B-4. RESULTS BY RACQUET SETUP. The following section presents a graphic display of the results of the average of all impacts for each racquet. This set of graphs represents a "ranking" of racquets in each parameter measured. Depending on the particular parameter, most or least does not necessarily mean best or worst — that will depend on what result you are trying to achieve. To see which racquet setup corresponds to the setup codes on the graph, click the drop down menu.
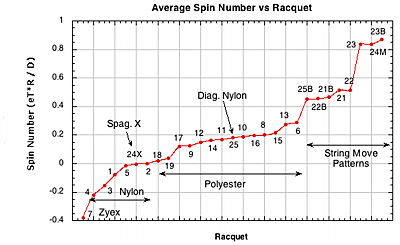
Figure 21 — Spin Number vs Racquet Setup. Spin number correlates almost exactly with setup. All the nylons, polyesters and string movement racquets group together. The odd balls also fit where they should. The spaghetti crosses only racquet (24X) behaves like a nylon because the strings don't move at all and the diagonal nylon (25) fits in with the polys because the pattern is a movement pattern but the string is nylon, so the effect of each averages to the middle.
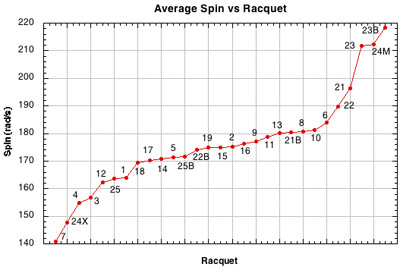
Figure 22 — Spin vs Racquet Setup. This graph is similar in content to Figure 13, but breaks the group averages up into individual racquets. Except for the extreme string movement patterns, most of the individual differences between setups is quite small and the relative positions of racquets might well be different had we fired 100 more balls at each setup. The main differences are really group differences reflected by the two steep sections and flatter section of the graph.
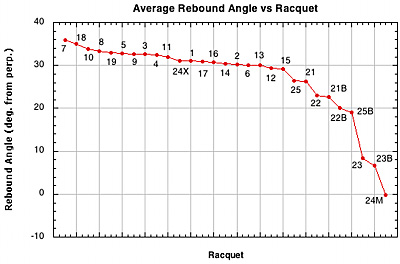
Figure 23 — Rebound Angle vs Racquet Setup.
Every other pattern besides the standard 16x19 produced a lower angle to the racquet perpendicular. To the player and spectator that is a higher launch angle. All these "alternative" patterns have much more lateral string movement than the 16x19 pattern. The lateral force that results both spins the ball and slows it across the stringbed, affecting the rebound angle as it does so (as shown in Figure 11). On setup 24X the ball hits the cross string side. It still moves the main strings, though not as much, and the ball is partially shielded from the full effect of the snap-back by the crosses.
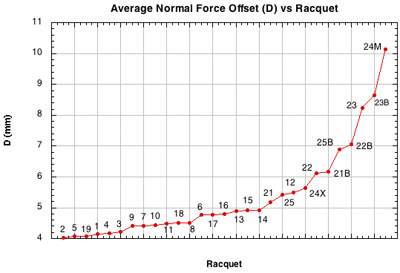
Figure 24 — Normal force offset (D) vs setup.
Again, all the string movement patterns have greater normal force offset, most of which also had the most spin. This can be very deceiving. As shown in Figures 17-20, for a given setup, D offset in inversely related to spin. In other words, the extra string movement caused the alternate patterns creates both more spin and more counter-spin offset — the offset is now inhibiting a much higher baseline spin, so the result compared to traditional patterns is still more spin. But for any given setup, the shot with the lower D will probably produce the most spin.
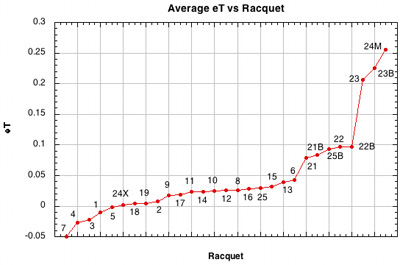
Figure 25 — Tangential coefficient of restitution (eT) vs Racquet Setup.
Another tricky one. When there is a lot of string movement, friction is constantly turning itself off and on depending on the relative motion of the ball and string surface, but D offset never turns off nor do the elastic forces slowing the ball. So sometimes Vx2 slows in greater proportion than spin increases, or sometimes it decreases less than spin increases. As a result, and shown in Figures 43-46 in the Appendix, eT is not highly correlated to absolute spin, except for nylon and 3-plane spaghetti patterns, as described in those sections.
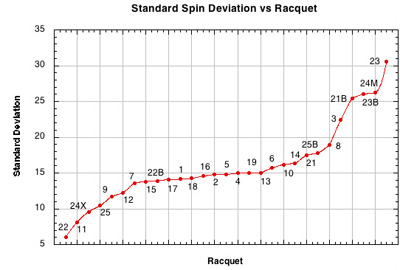
Figure 26 — Standard deviation on spin vs Racquet Setup. All the alternative patterns also have the highest standard deviation on spin. Not only is this because the strings move more in these patterns, but they also move more unpredictably and randomly. The number of strings and distance they move can very radically from hit to hit based on very small differences in where and how the ball is incident.
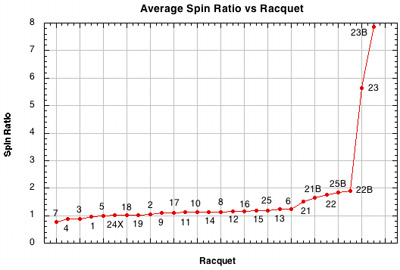
Figure 27 — S ratio (S) vs Racquet Setup. S-ratio = Rω2 / vx2. If it is greater than 1, then the ball is in post-rolling mode and the peripheral spin speed is greater than the speed parallel to the stringbed. If S=0, the ball is rolling, and if less than 1, it is sliding. This is a useful parameter for nylons and polyesters in more traditional closed patterns and perhaps with some wider patterns like the 16x15. But with the spaghetti patterns it can sometimes become meaningless because it approaches infinity as the parallel speed approaches zero. The fact that the measured S-ratio was larger than 1.0 for experiments with polyester was one of the first indications that something was affecting spin more than the simple friction model.
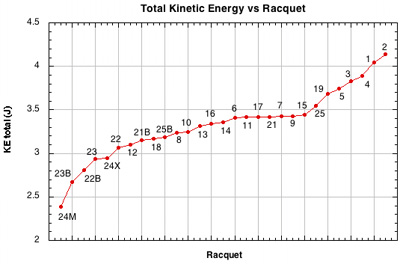
Figure 28 — Kinetic energy (KE) vs Racquet Setup. The kinetic energy is the sum of the linear and rotational energies (.5mv2 and .5Iω2 respectively, where m is mass and I is moment of inertia). This may be a measurement of a so-called "heavy ball". Another measurement might be to use only the ball's energy going in the direction parallel to the strings — .5mvx2. This added to the rotational energy would give the energy parallel to the stringbed.
Because setups with high string movement slow the parallel speed more, the outgoing speed of the ball will be less. Ball speed contributes by far most of the total KE, so the string movement setups tended to have less total KE. That is paradoxical since those racquets create more spin. A heavy ball is the right combination of spin and speed.
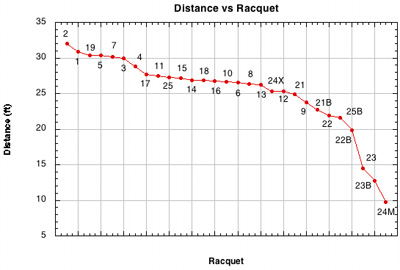
Figure 29 — Calculated rebound distance vs Racquet Setup. The spin, speed, and angle were entered into trajectory calculator using a fixed hitting height to calculate distance the rebound would fly. For the alternative patterns here, the lower velocity (due to lower vx2 and the higher launch angle combine for a slower, higher, shorter trajectory. Left alone, the opponent would jump on such a ball. But such a trajectory also means the player can swing faster, either flatter or steeper, and have more control over where and how to place a ball.

Figure 30 — Power Potential (ACOR) vs Racquet Setup. ACOR is probably the most sensitive parameter to hitting location. It just so happens that all the strings with the highest ACOR hit closest to the throat, which is where maximum ACOR is.
PART 3: DISCUSSION
In any discussion on spin, the underlying question is, how much spin is too much and how much spin is possible? The ITF banned spaghetti strings. They found that the spaghetti patterns produced up to 50% more spin than did nylon strings. Their tests were performed with clamped racquets. The present experiment was performed with hand-held racquets and faux spaghetti strings generated only 22-27% more spin than the nylon and polyester strings in the same racquet and pattern. How much is too much is a subjective judgement based on how it will affect the nature of the game. But it is interesting to compare this to the maximum theoretical spin.
3A. Maximum Theoretical Spin
We will assume that the racquet is clamped somehow such that it does not move before or after impact. The outgoing spin of the ball depends on the speed, incident angle and spin of the incoming ball, and it depends on how much energy is lost in the ball and the surface during the bounce. The maximum possible spin would result if no energy was lost and then
ω2 = ω1 - 39.1(vx1 - Rω1)
where ω2 is the outgoing spin of the ball in radians/sec, ω1 is the spin of the incoming ball, vx1 is the speed of the incoming ball parallel to the surface and R is the radius of the ball. If vx1 = 20 m/s and R = 0.033, then
ω2 = 782 - 0.29ω1
which means that the outgoing spin is largest if the incoming ball has backspin (then ω1 is negative). For example, if ω1 = -300 rad/s, then ω2 = 869 rad/s = 8298 rpm. That is a huge amount of spin, much larger than is ever observed off the court or off the strings of a racquet. In practice, the spin is much less than that for two reasons. The first is that energy is always lost in a tennis ball when it bounces. A small amount of energy is also lost in the strings. In addition, as discussed in section 1C on normal force offset, spin is reduced by the fact that the vertical force on the ball while it bounces does not act through the middle of the ball. It acts through a point ahead of the middle as shown in Figures 4-6.
3B. Effect of Impact Location on Results.
The racquet was hand-held for all impacts. This was done to better mimic the impact conditions of a tennis stroke. In a previous experiment, we found that a hand-held racquet produces about 30% less spin than a clamped racquet. The reasons are that the hand-held racquet will recoil, twist and vibrate during impact whereas the a clamped racquet does not. The effective weight of a totally secured and clamped racquet is essentially infinite, so the impact forces will be much greater, there will be more string movement and there will be more spin. It also will not matter much where on the stringbed you hit. The rebound speed will be about the same.
For a hand-held racquet, the impact location will have an effect on the rebound. A map of all the locations for each setup group is indicated in Figure 31. The distances are measured from approximately the center of the stringbed.
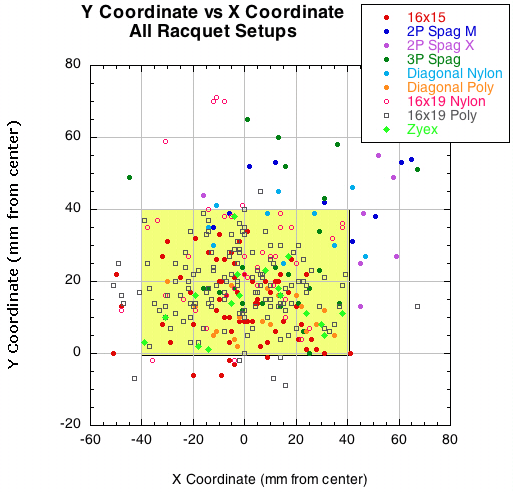
Figure 31 — Impact location measured from center of stringbed. The yellow area is where most of the hits occurred — basically 1.5 inches either side of the center axis and 0-1.5 inches toward the tip from the center of the stringbed. All measurements were made at the maximum impact point as determined from the camera images from behind the racquet.
We found five significant correlations between impact location and rebound parameters. First, ACOR predictably decreased from side to side of center and toward the tip. This is to be expected since the further from center, the more the racquet will rotate, diminishing energy return to the ball. Also, the racquet has a higher effective mass he close the impact is to the throat, so the racquet will recoil less and return more energy. Figure 32 shows these relationships.
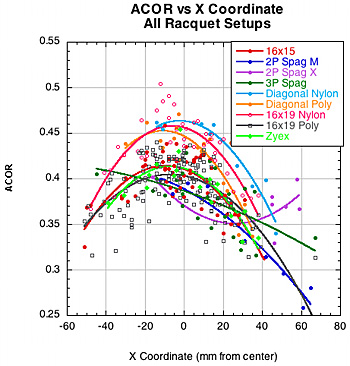
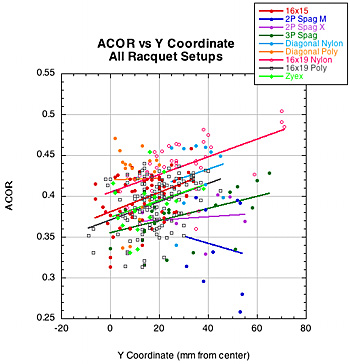
Figure 32 — ACOR vs X (left) and Y (right) Coordinates.
The most interesting correlations were, first, between the D-offset and the X coordinate, and second, between spin and the X coordinate. The first helps explain the second. Based on the trajectory of the incident ball, all negative X locations would correspond to the bottom half of the racquet during a stroke, and all positive locations on the top half (halves measured on either side of the tip-to-butt axis). As can be seen from Figure 33, D-offset is less to the left (bottom half) and more to the right (top half). This is because the racquet is rotating away from the leading side of the ball, thus decreasing the normal force in this area. On right side of the graph, the racquet is rotating into the leading edge of the ball, increasing the offset force in the front of the ball. The result is that there is greater spin created on the bottom half of the racquet compared to the top. Figure 31 shows these relationships. Also, these results corroborate the results of the experiment "Spin and Impact Location" found elsewhere on TWU.
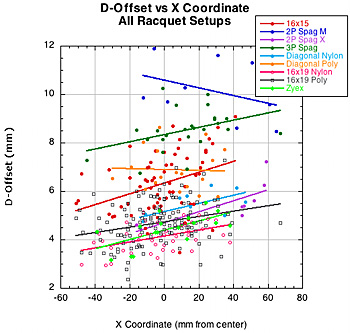
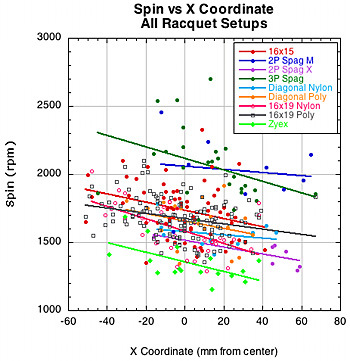
Figure 33 — D-Offset vs X coordinate (left) and Spin vs X coordinate (right).
The last correlation to impact location was rebound angle. For impacts on either side of the tip-to-butt axis, the rebound angle increased from the perpendicular. That translates to a lower launch angle. There was no correlation between the Y impact point and the rebound angle. As usual, the only setup this does not hold for is the 2-plane spaghetti X pattern.
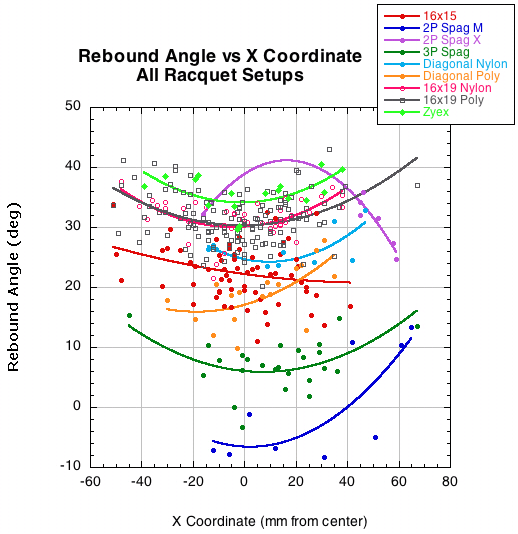
Figure 34 — Rebound angle vs X coordinate.
In spite of this dependence on impact location, we did not correct or normalize for location. First because the correction amounts would be small, second because the correlation values, though apparent, were often on the weak side, and third because most setups had impacts distributed on each side of the axis and averaged each other out.
3C. The Special Case of the Diagonal Pattern.
The PowerAngle diagonal pattern is a completely different animal. Both "crosses" and "mains" move simultaneously. This leaves a large "hole" on the trailing side of the ball compared to other setups, while concentrating more string further forward to increase D-offset. When the strings snap back, one produces topspin and sidespin to one side, and the other produces topspin and sidespin to the other side. The two side spins will tend to cancel and the topspin components will add.
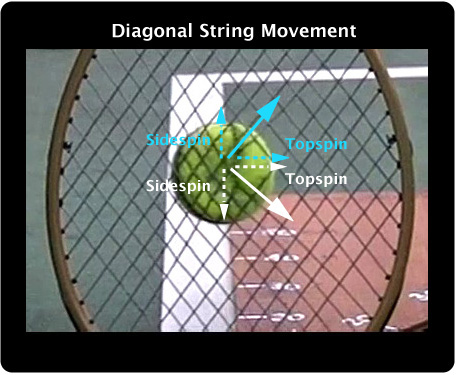
Figure 35 — Diagonal Pattern String Movement and Snap-back.
3D. The Effect of Randomness.
There is an essential randomness built into every impact. For nominally identical input parameters of spin, speed and angle, there can be quite different outcomes in outgoing spin, speed and angle. It is often just a matter of chance how the ball will grab any particular string and move it. This helps to explain the scatter in many of the graphs.
PART 4: CONCLUSION
This study found several parameter relationships that affect spin and rebound angle, assuming all incident parameters being equal (spin, speed, angle). The most dramatic effect of racquet setup on spin and angle (expressed as "launch angle" to the court) occurs with setups that allow for lateral main string movement and snap-back. The hierarchy from most spin and highest launch angle to least spin and lowest launch angle is (1) spaghetti-type patterns, (2) wide-open patterns like the 16x15 pattern, and (3) slippery vs sticky inter-string friction setups — i.e., polyester vs nylon.
Four parameters were found to significantly influence the net effect of the racquet setups on spin and rebound angle:
- Normal Force Offset (D-offset).
- Tangential Coefficient of Restitution (eT).
- Coefficient of Friction as expressed in the Spin Potential ratio.
- Impact Location on either side of the longitudinal (tip to butt) axis.
In general, within any setup category, the relationships to spin and angle are these:
- Normal Force Offset (D-offset): With increase in D, spin decreases and launch angle increases.
- Tangential Coefficient of Restitution (eT): With increase in eT, spin increases and launch angle increases.
- Coefficient of Friction as expressed in the Spin Potential ratio: with increase in SP, spin increases and angle increases.
- Impact Location on either side of the longitudinal (tip to butt) axis: spin increases as impacts move from top to bottom of horizontally held racquet.
D-offset and eT have opposite effects on spin as each increases. The spin number ratio (SN = eT*R / D) expresses the net effect of these two parameters. As such, it is the most reliable indicator of the net effect on spin of each and of the relationship of spin to launch angle. As SN increases, both spin and launch angle increase.
The results presented here either extend or corroborate several previous experiments available on TWU.
1. The relationship of string pattern to spin was previously studied (Spin and String Patterns) at lower impact speeds and its results were confirmed in the present experiment using high-speed impacts.
2. The relationship of string material to spin was previously studied here: "Spin and String Material"..
3. A previous experiment on the role of impact location on spin is presented in "Spin and Impact Location".
4. The role of both interstring and ball-string friction has been extensively studied in the following: "Static Friction and Spin", "Sliding Friction and Spin", and How String-To-Ball Friction Influences Spin", among others.
PART 5: APPENDIX
Many additional results are presented below as well as a mathematical analysis. This material focuses on the influences of the spin parameters on each individual racquet setup.
5A. Detailed Graphical Analysis By Racquet Setup
The correlation of spin to spin number.
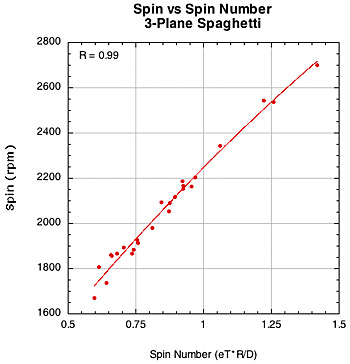
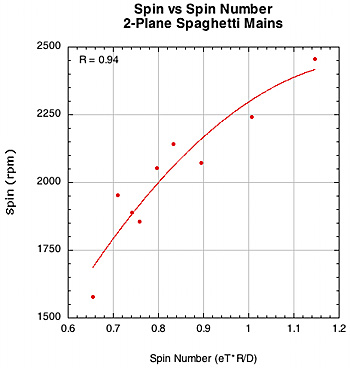
Figure 36 — Spin vs Spin Number for spaghetti racquets.
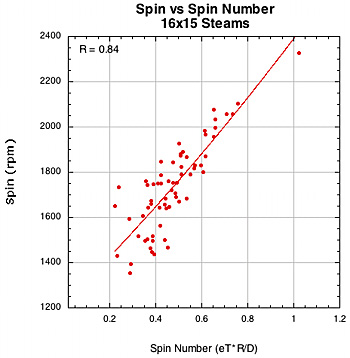
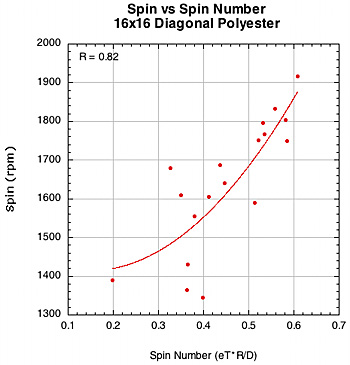
Figure 37 — Spin vs Spin Number for 16x15 Steams and 16x16 diagonal patterns.
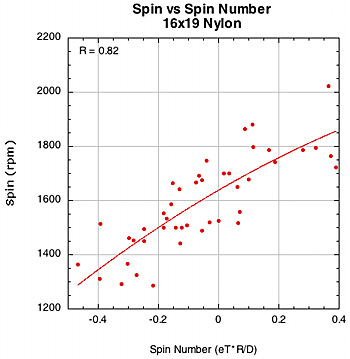
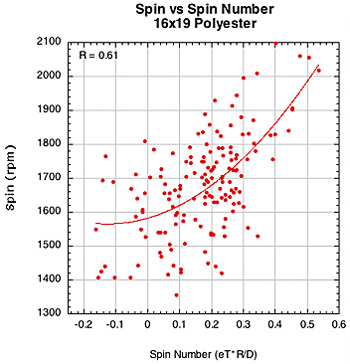
Figure 38 — Spin vs Spin Number for 16x19 nylon and polyester patterns.
The weaker correlation between spin and spin number for polyester in the 16x19 pattern is somewhat of a mystery. Polyester has a strong association with D-offset (0.77) but a weak one with eT (0.37). So the spin number corrects for this somewhat, but still remains a bit weak.
The correlation of spin to D-offset. Figures 39-42 show the relationship of spin to the normal force offset (D) for each material and pattern. D-offset has a strong inverse correlation with polyester but a much weaker one with nylon. This is true of the 16x19 and diagonal patterns, the only two patterns that had both polyester and nylon versions of the setup. The correlation is strongest for the 16x15 polyester patterns. The spaghetti patterns, even though all strung with polyester, have a weaker D-offset to spin correlation. Unfortunately, the number of impacts on the spaghetti racquets, especially the 2-plane version, was small.
The reason for the higher correlation to polyester than to nylon is as follows. Polyester strings tend to move more than nylon. In so doing, they push forward, increasing the distance of the normal force offset, thereby creating more counter-spin torque. The range for D-offset for poly is about 4mm and about 2mm for nylon. This added range creates stronger forces to affect spin. Without the added string movement and counter-torque, nylon's affect on spin is more purely frictional. And because the ball typically slides (or rolls) throughout a nylon impact, there is very little variation in the causative factors affecting D. The significant variation in D occurs with string movement typical of polyester.
The lower correlation between D-offset and spin for the spaghetti strings is indeed a bit strange. However, the distance that D can be offset approaches a maximum. You can only move so many strings so far. At some point, any extra movement of string is likely to add more elastic snap-back increasing spin more than in creating any additional counter-spin torque due to minimal increases in D-offset.
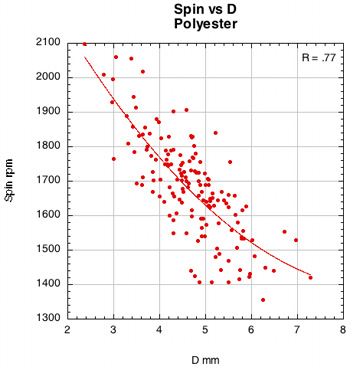
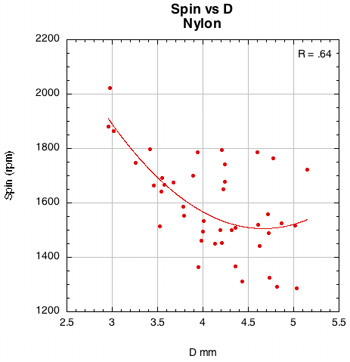
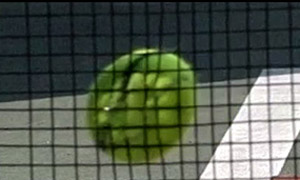
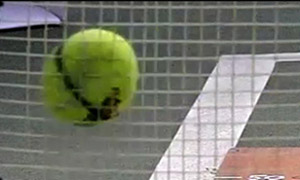
Figure 39 — Spin vs normal force offset for polyester and nylon.
The images here are of the impact that created the highest spin for each setup — i.e., the highest dot on each graph.
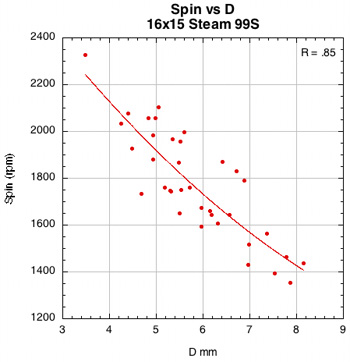
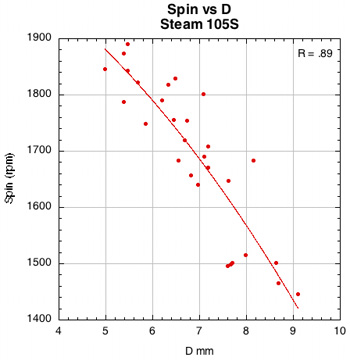
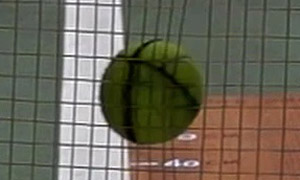
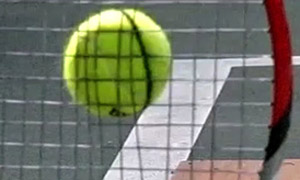
Figure 40 — Spin vs normal force offset for 16x15 Steam 99S and Steam 105S.
The images here are of the impact that created the highest spin for each setup — i.e., the highest dot on each graph.
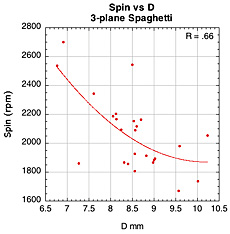
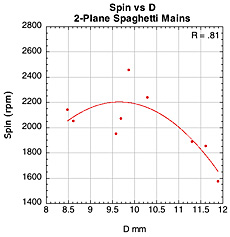
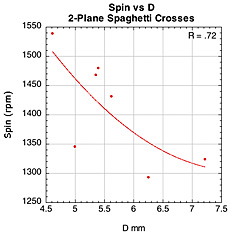
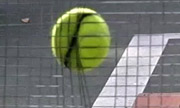
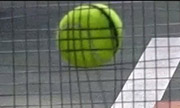
Figure 41 — Spin vs normal force offset for spaghetti patterns.
The images here are of the impact that created the highest spin for each setup — i.e., the highest dot on each graph.
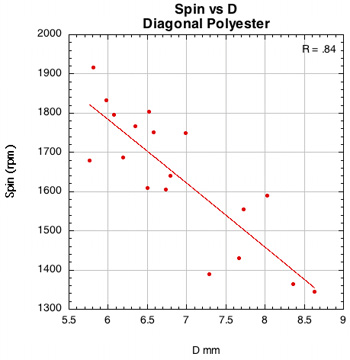
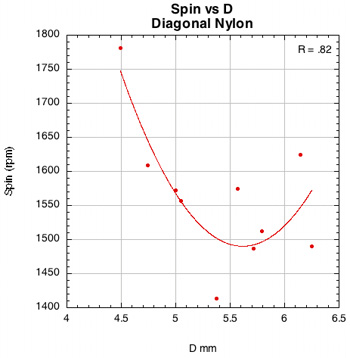

Figure 42 — Spin vs normal force offset for PowerAngle 16x16 diagonal with poly and nylon.
The images here are of the impact that created the highest spin for each setup — i.e., the highest dot on each graph.
The correlation of rebound angle to D-offset. Figures 43-46 show the relationship of normal force offset (D) to rebound angle for each material and pattern. As D-offset increases, the rebound angle to the perpendicular decreases. The explanation of the difference between polyester and nylon is basically the same as in the spin vs D-offset section above. The added string movement slows the ball's forward motion and decreases the rebound angle. This is seen as a higher launch angle on the court. For nylon, primarily only friction is involved in changing the speed parallel to the strings, and the range within which the speed can be changed is very small on either side of the rolling speed.
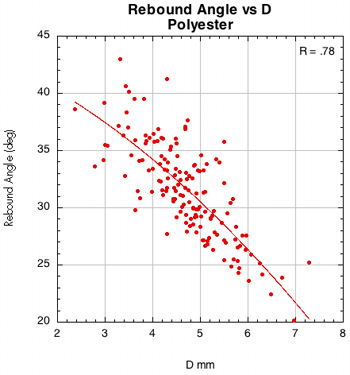
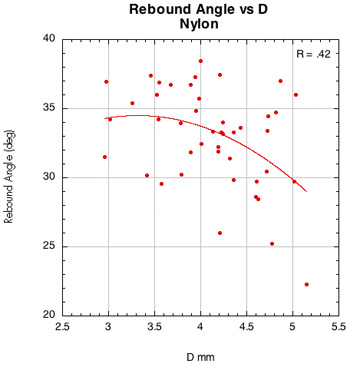
Figure 43 — Rebound angle vs normal force offset for polyester and nylon (16x19 setups).
The images here are of the impact that created the lowest rebound angle to the perpendicular (highest launch angle) for each setup — i.e., the lowest dot on each graph.
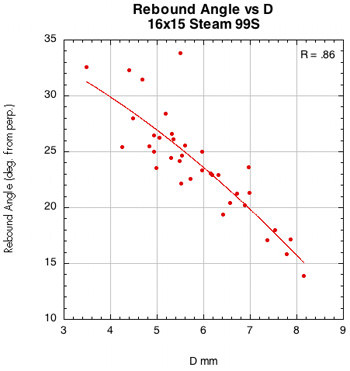
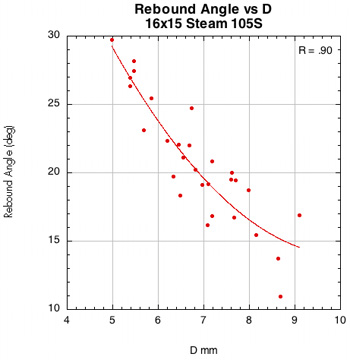
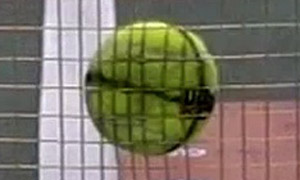
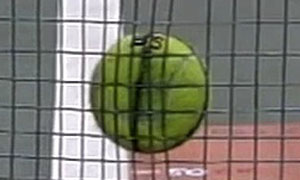
Figure 44 — Rebound angle vs normal force offset for 16x15 Steam 99S and Steam 105S.
The images here are of the impact that created the lowest rebound angle to the perpendicular (highest launch angle) for each setup — i.e., the lowest dot on each graph.
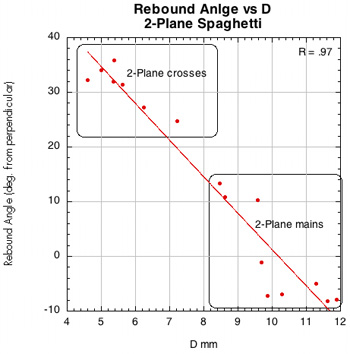
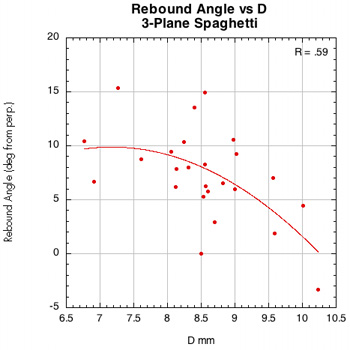
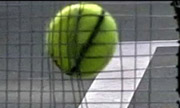
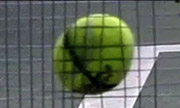

Figure 45 — Rebound angle vs normal force offset for spaghetti patterns.
The images here are of the impact that created the lowest rebound angle to the perpendicular (highest launch angle) for each setup — i.e., the lowest dot on each graph.
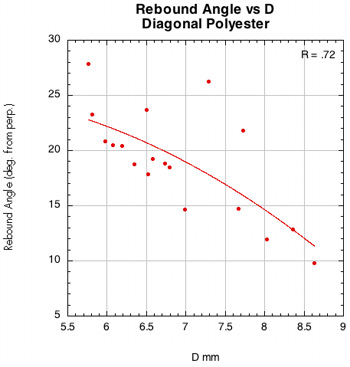
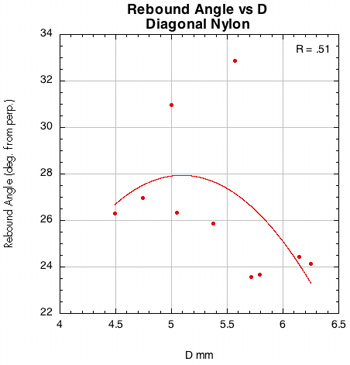

Figure 46 — Rebound angle vs normal force offset for PowerAngle 16x16 diagonal with poly and nylon.
The images here are of the impact that created the lowest rebound angle to the perpendicular (highest launch angle) for each setup — i.e., the lowest dot on each graph.
The correlation of spin to eT. Figures 47-50 show the relationship of tangential coefficient of restitution to spin for each material and pattern. Whereas the strongest correlation between spin and D-offset is with polyester, for eT and spin, it is the other way around — nylon is strongly correlated and polyester is not. For polyester, the effect of D-offset overwhelms and hides the effects of eT. For nylon, friction acts to influence spin more predictably, increasing it steadily as the parallel speed slows and the spin speed increases up to the point where rolling occurs.
The reason eT and spin are so strongly correlated with spaghetti patterns is because the parallel speed, vx, is very close to zero. If you look at the equation eT = - (vx2-Rω2) / (vx1-Rω1), you see that the numerator reduces to spin speed when parallel speed is zero. And since the denominator is the same for all impacts, due to the normalization procedure, eT is solely related to spin.


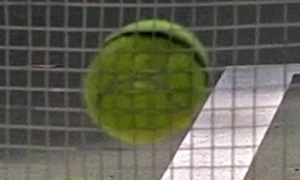
Figure 47 — Spin vs tangential coefficient of restitution (eT) for polyester and nylon (16x19 setups).
The images here are of the impact that created the lowest spin for each setup — i.e., the lowest dot on each graph.


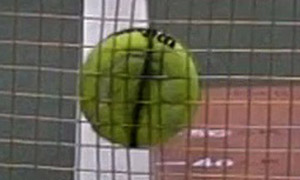
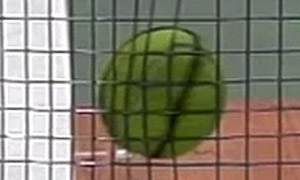
Figure 48 — Spin vs tangential coefficient of restitution (eT) for 16x15 Steam 99S and Steam 105S.
The images here are of the impact that created the lowest spin for each setup — i.e., the lowest dot on each graph.


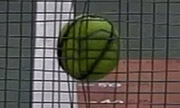
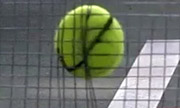
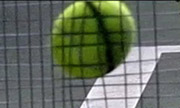
Figure 49 — Spin vs tangential coefficient of restitution (eT) for spaghetti patterns.
The images here are of the impact that created the lowest spin for each setup — i.e., the lowest dot on each graph.


Figure 50 — Spin vs tangential coefficient of restitution (eT) for 16x16 diagonal pattern with poly and nylon.
The images here are of the impact that created the lowest spin for each setup — i.e., the lowest dot on each graph.
5B. Mathematical Analysis
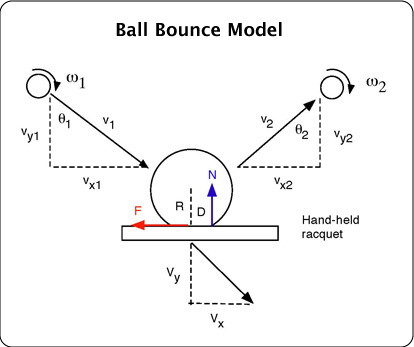
Figure 51. Parameters used below in the mathematical description of the bounce of a tennis ball off a hand-held racquet.
The time integral of the friction force is given by

where M is the effective mass of the racquet at the impact point. M is typically about half
the actual racquet mass for an impact in the middle of the strings. The time integral of the
normal reaction force is given by

where vy1 and Vy are taken as positive numbers for convenience, even though the ball is
incident in the negative y direction, and the racquet recoils in the negative y direction. The
coefficient of restitution (COR) in the y direction is defined by

It is useful to define an apparent coefficient of restitution, eA = vy2/vy1, ignoring recoil of
the racquet. eA is related to ey by

which is easily derived from Eq. (2). For a clamped racquet, where M is effectively infinite,
eA = ey ≈ 0.75 at incident ball speeds around 25 to 35 m/s. For a hand-held racquet, ey is
about 0.75 and eA is typically about 0.40, both for an impact in the middle of the strings.
In an analogous fashion, we can define a coefficient of restitution, ex, in the x direction,
by considering the tangential velocity of the contact point on the ball, given by vx – Rω. We
define ex in terms of the relative speed of the contact point and the racquet, by the ratio

ex is a measure of the elastic energy stored and returned to the ball as a result of tangential
distortion of the ball and the strings. In the same way, ey is a measure of the elastic energy
stored and returned to the ball as a result of distortion of the ball and the strings in the y
direction.
The ball changes spin during the bounce at a rate given by FR – ND = Icmdω/dt where
Icm = αmR2 is the moment of inertia of the ball about an axis through its center of mass.
For a tennis ball, α= 0.55. Hence,

Equation (6) provides a simplified expression for the change in angular velocity of the ball,
in that R, D and α are all assumed to remain constant during the bounce. In fact, the ball
squashes significantly during the bounce, in which case R will decrease to a value less than
that assumed in the following calculations, where we take R = 0.033 m. As a result, the term
FR overestimates the actual torque due to F and the true value of D will be over-estimated
by assuming that R remains constant. Since the time variation of R and Icm are unknown,
D can be regarded as a single parameter that combines the two non-ideal effects due to (a)
the change in ball radius and (b) the shift in the line of action of N during the bounce.
From Eqs. (1) to (6) we find that

where A = 1 + m ⁄M + 1⁄α . We also find that

Since Vx is not easy to measure, it is useful to define a more easily measured quantity,
eT , that ignores recoil of the racquet and that represents an apparent tangential coefficient
of restitution. We define eT by the relation

For a hand-held tennis racquet eT is typically in the range of -0.05 to 0.1. Small variations in D and in ex (or eT ) are the primary causes of the differences
observed between different strings in the spin imparted to the ball. Those differences can
occur randomly from one bounce to the next on any given string, and can vary in a systematic
manner from one string to the next.
Alternative expressions for vx2 and ω2, based on the definition of eT , can be derived from
Eqs. (1)-(6), giving

and
