ABSTRACT
For tennis players, the primary factor determining purchase of a tennis shoe is comfort. For researchers and manufacturers, injury prevention is a main area of interest, concern and design. For both groups, heel and forefoot cushioning and stability is the common denominator between comfort and injury reduction. The objective of the experiment was to examine cushioning effects at different impact energies for both heel and forefoot, determine how stiffness affects cushioning and the player's response to it, and to compare multiple shoes on all parameters. Sixteen shoes from ten manufacturers were tested in both static and dynamic situations. Shoes were compared in the following parameters: Peak force, deceleration, and deformation; time to peak and contact duration, energy return and absorption, stiffness, load rate, and shoe thickness. The results showed that there are significant differences between shoes on all measures. Comparison tools were then programmed and uploaded to the internet to facilitate tennis shoe comparisons. Shoes will be continuously added to the database as they are introduced to the market and tested.
1. INTRODUCTION
1.1. Forces in Running
Much research has been done on the impact forces involved in running, primarily because high forces have been the prime suspects in contributing to acute and chronic lower leg injury and pain. Many studies have chronicled the occurrence of lower extremity injuries in running (and tennis) and causative relationships have been sought. To that end, mechanical tests on shoes have been performed in the lab and biomechanical data have been gathered from athletes running on force plates, shoes instrumented with pressure insoles, or from tracking markers attached to various positions on athletes legs and shoes. Video has also been used to augment the collection of kinematic and kinetic data. The two major areas of concern garnered from analysis of this data is the initial contact of the heel and surface in heel-toe running and the medial-lateral stability of the foot during the stance phase of the gait. Much research has been directed toward these topics, yet for years there has been no conclusive epidemiological and etiological evidence to conclusively connect these with injury (Nigg, 2001). At best, injury has been proven to be associated with impact shock and foot movement, but proven causality remains elusive. And to complicate things further, in spite of all the research and development that has gone into footwear, running injury rates have not declined (Lieberman, 2012).
Force plate signals acquired during heel-toe running reveal two ground reaction force (GRF) peaks — a first transient passive peak and a second larger and longer active peak (Figure 1). The smaller passive peak occurs during the first 50 ms of heel contact and is passive because it occurs during the period of muscle latency during which muscular reactions to impact have not yet been activated. This is pure impact force which initiates vibrations in the bones and joints of up to 20 Hz and sends a shock wave from the lower extremities all the way up to the head. In fact, deceleration at the foot is typically around 15 to 20 g and from 1-3 g at the head (Shorten, 2000). Impact will cause the ligaments, tendons and muscles to vibrate at lower frequencies. The active peak occurs during the propulsive portion of the gait after the weight has been shifted over the forefoot and the muscles are actively pushing off from the surface. The magnitude of the vertical GRF in heel-toe running typically varies between 1 and 3 times bodyweight (Cavanagh & Lafortune, 1980) and will depend on many factors including running speed, weight, lower extremity kinematics, surface, gradient, shoe, and athlete adaptations. The interpretation of how the high and low frequency vibrations are summed, analyzed, and interpreted also influences the determination on the "effective" impact magnitude (Nigg, 2001; Hennig, 2011; Shorten & Mientjes, 2011).
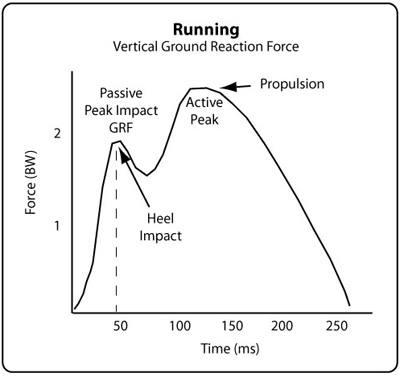
Figure 1 — Ground reaction force for running (adapted from Cavanagh, 1980).
The lateral (outside) portion of the heel typically strikes the ground first due to supination about the ankle joint. After contact, the ankle rotates medially and the foot rolls inward, or pronates. Too much pronation can transmit excessive forces to the angle, knee, and hip, causing pain and/or injury. This foot pronation is the primary instability that shoe manufacturers have tried to address in their designs.
Shoe designers have attempted to deal with the dual problem of impact and instability by adjusting the width, thickness and stiffness of the shoe midsole. For shock absorption, thickening and widening the heel will spread the impact force out in both space and time. Adjusting the stiffness of the heel and the medial and lateral midsole helps to control the rate of loading and rotation. Properly adjusting stiffness is important to prevent bottoming out during impact. Having a stiffer medial than lateral midsole will help minimize pronation. Adjusting stiffness is augmented by adjusting geometry. Varus and valgus wedges (thicker areas in the medial or lateral midsole) have also been used to control motion.
However, there is often a trade-off between injury mitigation and performance. For example, a wider heel might distribute the impact force over a wider area, lessening foot pressure, but it will also increase the length of the moment arm (and thus torque) about the ankle joint. Similarly, thickening and softening the midsole will increase the duration of the impact, but could also do so for the push-off, decreasing the explosiveness of the movement. There is also the question of the metabolic cost of an alteration in midsole stiffness. Costs in oxygen consumption and muscle fatigue are possible consequences. The trick for the designer is to achieve the correct balance.
1.2. Forces in Tennis
There have been far fewer studies on impact forces in tennis. Much of the science of tennis shoe design has been imported from running research. But since the demands of the sport are different, the shoe requirements are also different. Running motion is predominately a singular, repetitive action, with relatively unchanging kinematics from step to step. Contrariwise, tennis players do very little heel-toe running. Even pure heel landings are scarce except on such shots as running forehands (Figure 2). Otherwise, players spend most of the time on their forefoot, sprinting, jumping, changing direction, rotating, hopping, and ready position (Figure 3). How do the kinematics of player and shoe respond to this variation in forces arising from these different movements?
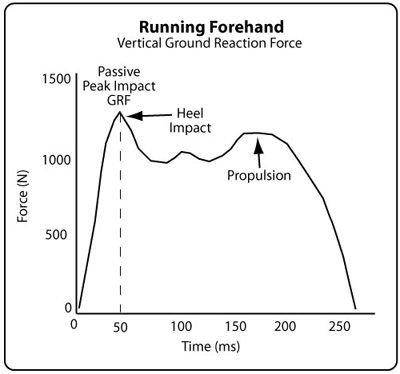
Figure 2 — Ground reaction force for running forehand (adapted from Damm et al., 2015).
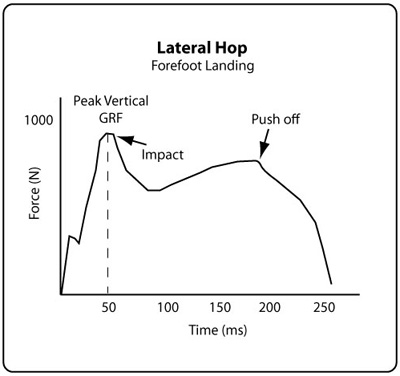
Figure 3 — Ground reaction force for lateral hop step (adapted from Luethi et al., 1986).
The most obvious difference between running and tennis foot plants is that the ground reaction force in the impact phase of the landing is the highest part of the curve for tennis. The peak propulsive force is less. This is due to the abrupt, high speed stops required in tennis.
The shoe influences how the player responds to these abrupt decelerations. For example, during a sideways hop, it was determined that the stiffness of the shoe influenced the inversion of the foot and that pain was correlated with the amount of inversion (Luethi et al., 1986). A very soft shoe can reduce shock but cause excessive motion and torque at the joints. A stiff shoe may limit torque at the cost of greater shock. Each movement will have a different tradeoff function depending on the direction and magnitude of forces that a joint can accommodate without injury.
1.3. Mechanical (in vitro) vs Biomechanical (in vivo) Testing
But there is an apparent contradiction that hovers over mechanical impact absorption testing which challenges its validity as a reliable predictive indicator of force attenuation (shock absorption) — the impact forces recorded by mechanical testing do not correlate well with those recorded by athletes running or cutting on force platforms (Hennig, 2011; Wright et al., 1998; Nigg & Yeadon, 1987; Nigg, 2001). During running, force plate analysis has demonstrated that the vertical ground reaction force is not reduced with added cushioning, and in some cases, even increases (Clarke, 1983; Dixon & Stiles, 2003; Stiles & Dixon, 2006). This is contrary to the findings of mechanical and material testing in the lab and to theoretical models. Two explanations have been offered to explain this apparent contradiction: athlete adaptation and measuring technique.
Adaptation. It has been shown that runners alter their kinematics to perceptions of the stiffness of the shoe-surface interface (Hennig et al., 1996; Starbuck et al., 2013). Also, the muscles themselves might have an active feedback system that alters kinematics to the surface stiffness (Nigg, 2001). For a stiff shoe-surface interface, these adaptations include a flatter foot landing (midfoot or forefoot), greater knee bend, and a shorter, faster stride. This change in kinematics redistributes the loading on the body — more toward the foot and ankle than the knee.
These adaptations are similar to the kinematics of barefoot running. Lower impact forces have been recorded in barefoot running compared to shod running. Barefoot runners typically display a reduced or non-existent passive impact peak. Barefoot proponents have argued that barefoot running technique is a product of evolution as opposed to shod running which predisposes heel-toe foot strikes and the greater impact forces that accompany them (Lieberman, 2012). To extrapolate, it is natural for us to adopt these kinematics whenever stress-inducing foot strike collisions are imminent, such as with a stiff shoe or surface.
So what is more important — the shoe or the striking technique? Or similarly, does the shoe determine the landing technique or does the landing technique determine the need for a type of shoe? One study showed that striking condition affects the impact force more than the footwear worn (Shih et al., 2013). However, if both barefoot and shod conditions land with the same kinematics, then there will be a lesser force in the shod case.
Adaptive behavior implies, first, that the player can identify the mechanical properties of the shoe and surface and, secondly, that the player has a preferred or acceptable target loading profile that weighs shoe vs strike technique and performance vs injury risk. The adaptation will scale to the properties of the impact interface. If the body can't sufficiently mediate these forces, they may become excessive. The force mediation will be individual to each player.
In this sense, the mechanical testing becomes even more important because it indicates the direction and magnitude of the likely adaptations. It is the mechanical property that begins the whole chain of perception, feedback, and adaptation, which ultimately results in movement, load, and performance modification. Mechanical testing is valuable in assessing the likely degree of kinematic adaptation to the shoe-surface interface or, if little adaptation occurs, to ascertain the degree of cushioning that is afforded by one shoe to another. And these modifications themselves may generate their own injury-risk environment.
Measurement technique. Another explanation given for the contradiction is that measurement of ground reaction forces with a force plate may misrepresent the local forces experienced by the lower extremities (Shorten, 2002, 2011). The force plate measures the magnitude of the resultant force of the runner's center of mass. But that resultant force is really the sum of several segment forces each acting with different magnitudes and directions (Bobbert et al., 1991; Damm et al., 2015]. The first passive impact peak is primarily generated by the rapid acceleration of lower leg segments while the magnitude is determined by the lower frequency motions of the rest of the body. This occurs because of the manner in which the fast and slow segment deceleration waves are added to each other to form the resultant wave produced by the force plate. For a cushioned shoe, the timing and addition of forces for the fast and slow moving body segments delays and increases the magnitude of the passive impact peak, hiding the cushioning effect and in contradiction to the mechanical impact tests that show that the passive impact force should decrease. The conclusion is that body segments should be isolated and analyzed separately in their own frequency domain. Presumably, the behavior of segments within each domain would then agree with mechanical predictions. As such, the in vitro tests could then be predictors of in vivo shoe cushioning just as theory would predict.
Alternative testing. The lack of agreement between in vitro and in vivo force measurements has led some researchers to look elsewhere for reliable predictive tests upon which to compare shoes. One such technique is to use instrumented insoles that measure pressure on the bottom of the foot. Insole data has proven to be a reliable predictor of forces during running (Dixon & Stiles, 2003). Insoles have the advantage that the data accumulated is local to the area of the foot being measured, uncoupled from events in other parts of the body. The disadvantage for use in comparing footwear is that the data is individualistic to the athlete wearing the shoes and insole.
2. EXPERIMENTAL ARRANGEMENT
Figure 4 shows the test rig to measure impact cushioning.
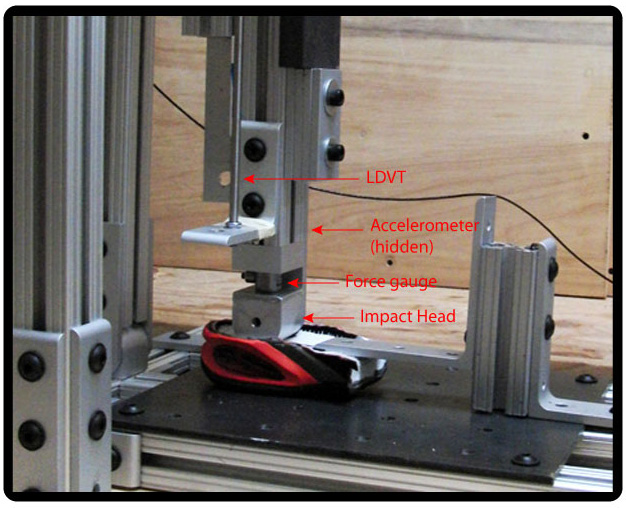
Figure 4 — Experimental Impact Apparatus: Setup for measuring tennis shoe impact cushioning and shock absorption.
Both heel and forefoot sections were prepared for testing. Shoes were all right-foot, men's, size 9. Uppers and insoles were removed and the shoes were cut into heel and forefoot sections. Sections were placed on a steel plate and secured in place at both ends of the segment. A gravity driven missile was used to impact the shoe. The missile mass was 7.5 kg with a rounded impact head. The head had a radius such that at impact the contact dimensions were 38 mm x 15 mm, and after 10 mm of compression, the contact was 38 mm x 35 mm. Though these dimensions are not those of the recommended ASTM 1976-13 test (an impact tup with 40 mm diameter and 1 mm radius on the edge), they approximate the impact profile of the calcaneus on heel impacts. A force gauge was inserted between the impact head and the main beam of the missile. An accelerometer was mounted to the missile beam 15 mm above the contact point. A linear differential voltage transducer (LVDT) was attached to the other side of the beam. Sole thickness was measured at the impact point. The heel impact location was 5.1 cm from the heel end forefoot impact was 6.4 cm from the toe end. The missile was manually elevated 50, 75, 100 and 125 mm above the shoe and dropped. Table 1 displays the missile velocity and energy at impact for each drop height.
| Table 1 Initial Impact Parameters | ||||
|---|---|---|---|---|
| Drop Height (mm) | Impact Velocity (m/s) | Impact Energy (J) | ||
| 50 | 1 | 3.7 | ||
| 75 | 1.2 | 5.5 | ||
| 100 | 1.4 | 7.4 | ||
| 125 | 1.6 | 9.2 | ||
Table 1 — Initial impact parameters.
Because the impact data were very consistent, only two impacts were performed for each drop height. The following data were collected for each drop: peak force, time to peak, impact duration, peak deformation, peak deceleration, load rate, rebound height, energy return, energy absorbed, and stiffness. Analog signals from the transducers were digitized and displayed on a Picoscope PC oscilloscope and analyzed. Data were then exported to a graphing program.
The 16 shoes tested in the experiment are presented in Table 2.
| Table 2 Shoes Tested | ||||
|---|---|---|---|---|
| Shoe Number | Brand | Shoe | Heel Thickness (mm) | Forefoot Thickness (mm) |
| 3 | Asics | Gel-Resolution 6 | 27.7 | 17.3 |
| 4 | Adidas | Barricade 2016 | 24.0 | 12.4 |
| 5 | New Balance | 996 | 24.4 | 12.0 |
| 6 | Prince | Warrior | 26.8 | 16.9 |
| 8 | Babolat | Jet All Court | 23.4 | 13.8 |
| 9 | Asics | Gel-Solution Speed | 24.7 | 14.5 |
| 10 | Wilson | Glide Comp | 20.4 | 14.4 |
| 11 | Adidas | Adizero Ubersonic 2 | 21.8 | 11.9 |
| 12 | Asics | Gel Game 5 | 25.0 | 15.0 |
| 13 | Babolat | Pro Pulse Fury | 25.9 | 13.5 |
| 14 | Head | Nitro Pro | 23.0 | 13.6 |
| 15 | Lotto | Stratosphere | 30.0 | 17.7 |
| 16 | Nike | Zoom Cage 2 | 25.9 | 15.3 |
| 17 | Prince | T22 Lite | 27.2 | 14.5 |
| 18 | Wilson | Rush Pro 2.5 | 22.6 | 14.7 |
| 19 | Yonex | Eclipsion | 24.0 | 15.2 |
Table 2 — Tennis shoes tested.
3. RESULTS AND DISCUSSION
A typical oscilloscope tracing is presented in Figure 5. The force, distance, and acceleration transducers all measure changes in voltage. The actual measurement units are calculated from the voltage based on the calibration of the devices.
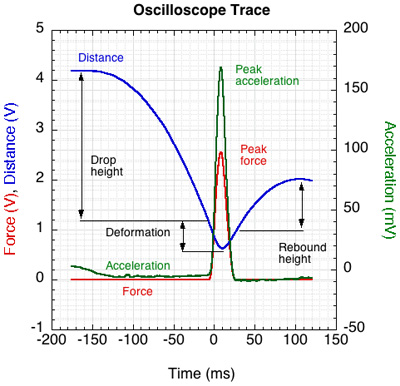
Figure 5 — Typical oscilloscope tracing. The drop height is measured from the starting height to when an impact force is first recorded. Deformation is measured from that point to the bottom of the distance curve. Rebound height is measured from when the force returns to 0 to the maximum rebound of the distance curve.
Data so collected are compiled in four ways below. First we examine how an individual shoe reacts to changes in impact energy (Section 3.1). Next we look at how impact variables for all shoes vary with shoe stiffness (Section 3.2). Third, heel and forefoot sections of all shoes are compared to each other on all variables relevant to cushioning (Section 3.3). And last, data are normalized to impact energy, shoe thickness, and shoe stiffness (Section 3.4). Doing so allows us to compress all the cushioning data onto a single comprehensive graph.
3.1. Measurements for Individual Shoes
To compare shoes, you first have to gather accurate, consistent, and meaningful data for each shoe. The graphs in Figure 6 are typical of heel and forefoot sections for each of the shoes. In general, as drop height increases, impact energy, force, deceleration, deformation and stiffness increase. Because the forefoot is thinner than the heel and has less cushioning, it experiences greater force and deceleration than the heel. Forefoot deformation is a greater percent of its thickness and it gets relatively stiffer for each mm of deformation than does the heel. The forefoot section many even come close to "bottoming out" on larger impacts. Consequently, the heel deforms more than the forefoot. As force increases, time to peak force (and contact duration) decreases. Energy return declines with greater impact force due to more material hysteresis and also vibration of the testing apparatus. For most variables, the slope of the forefoot curve is greater than that for the heel, indicating a faster rate of change as input conditions change.
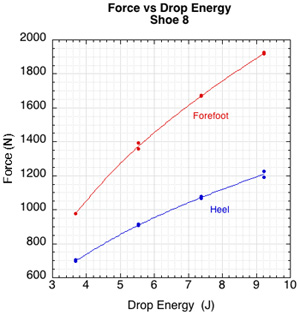
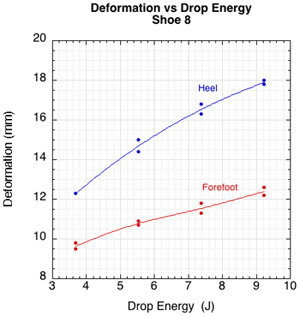
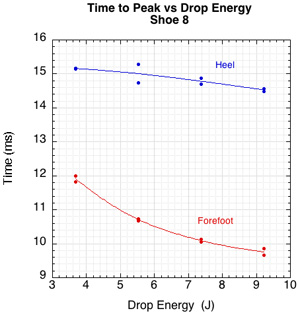
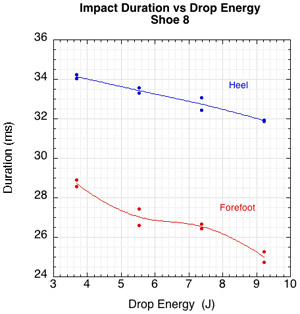
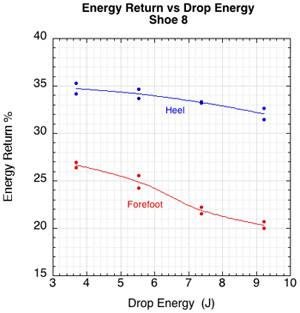
Figure 6 — Typical individual shoe graphs for selected impact variables.
The graphs in Figure 6 shows how cushioning variables for the heel and forefoot of a particular shoe change as the impact energy changes. Cushioning and comfort distill to this: how much force it takes for a given deformation (stiffness) and how long does it take (load rate)? Stiffness is a property of the shoe and it becomes manifest as load rate and deceleration, which describe the jolt to the body and joints. Percentage of energy return and loss (absorption) always add to 100%. These depend primarily on time to peak force and/or contact duration.
3.2. Measurements for All Shoes as a Group
Once we know that the response of each individual shoe heel and forefoot behave separately along a predictable continuum when inputs change, we want to know if shoes as a group or category do the same. In other words, if we can say that an individual shoe will behave in such and such a way, can we also say that shoes in general will do the same and that heels and forefeet also exist along the same continuum? When you want to know how a shoe will compare to another shoe and how heels compare to forefeet, stiffness is the best independent predictive variable. Stiffness is a property of the shoe. It is given by k = F/d, where k is the stiffness, F the vertical force, and d is the deformation. For each impact energy, Figure 7 places relevant cushion-related variables along a stiffness continuum. Both heel and forefoot segments are included on each curve. As stiffness increases, force, deceleration, and load rate all increase. Deformation, time to peak and duration all decrease.
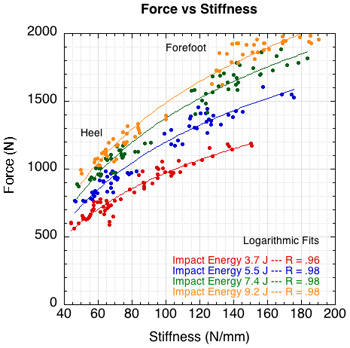
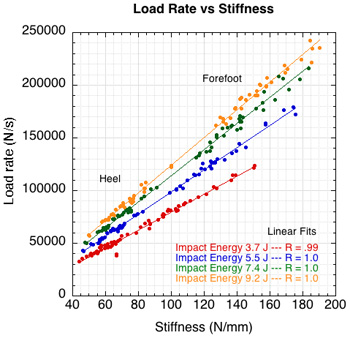
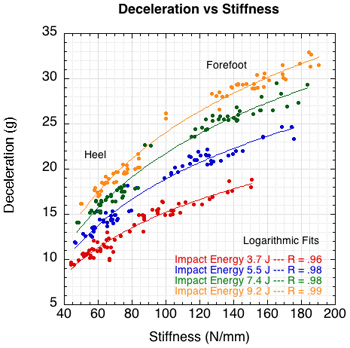
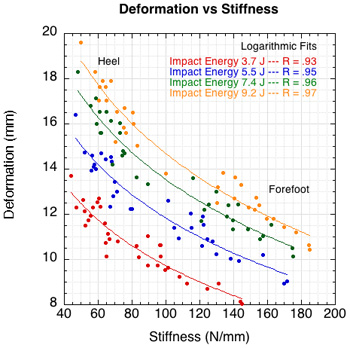
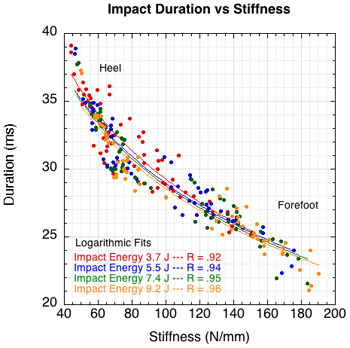
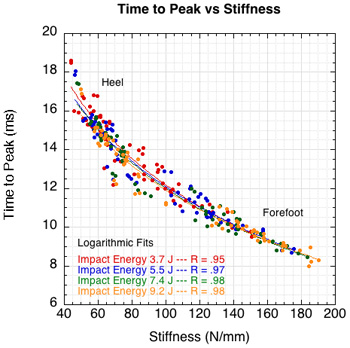
Figure 7 — How cushioning related variables vary by shoe stiffness and impact energy.
Cushioning is best achieved by low stiffness. This results in low force, loading rate, and deceleration. It reduces the impact shock over a longer time. The trade-off is that a very soft shoe can be an unstable shoe resulting in excessive foot movement, depending on where and how the cushioning is implemented.
3.3. Shoe-to-Shoe Comparisons of Heel and Forefoot
Consumers need direct shoe-to-shoe comparisons on all important performance variables in order to make an intelligent choice of footwear. Figure 9 compares all 16 shoes against each other on all variables. The comparisons are only made for the drop energy of 7.4 J since the shoes tend to maintain the same order at all impact energies. Figure 8 shows how shoes tend to remain in the same relative stiffness position as impact force is increased.
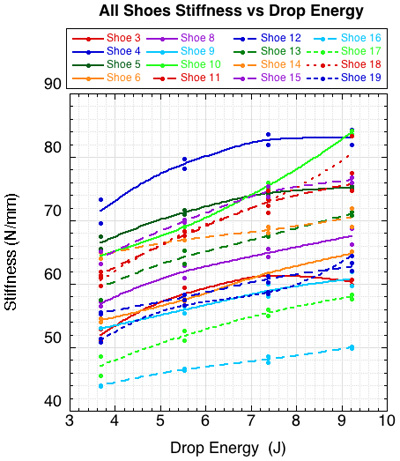
Figure 8 — Comparison of the stiffness of all shoes vs drop energy. There is very little crossover between curve fits indicating that the relative positions of shoes to each other remains the same over all impact energies.
First, the heel comparisons are displayed (Figure 9) and then the forefoot comparisons (Figure 10).
Heel Comparisons
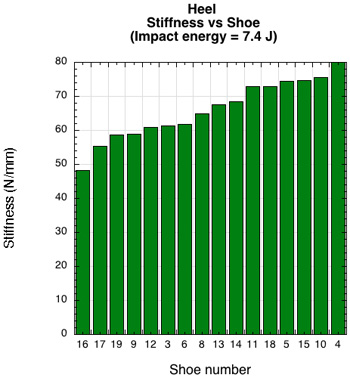
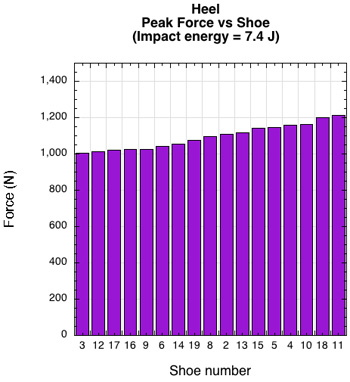
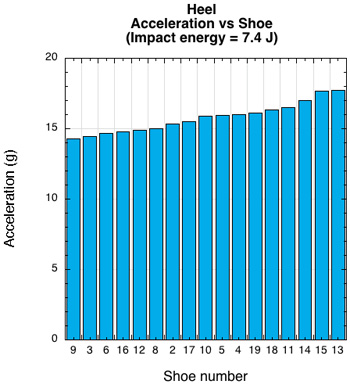
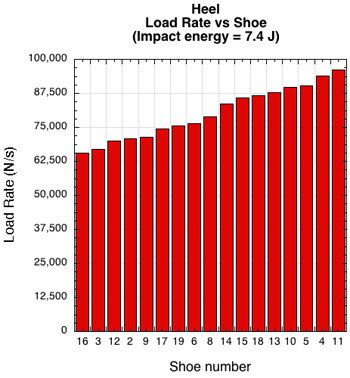
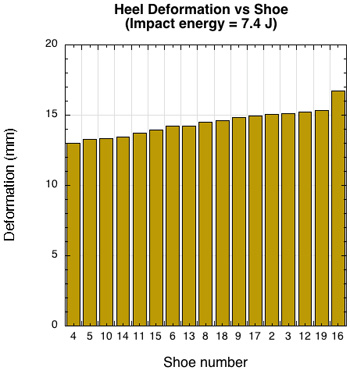
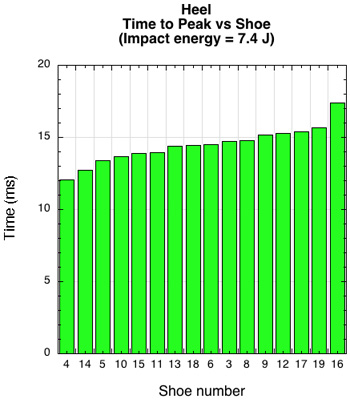
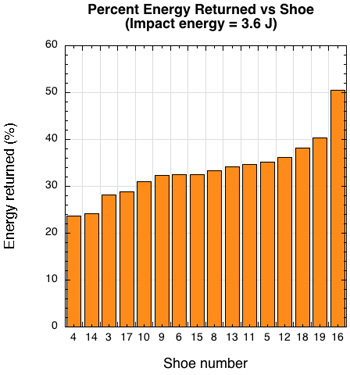
Figure 9 — Heel comparisons of all shoes in cushioning-related variables.
Forefoot Comparisons
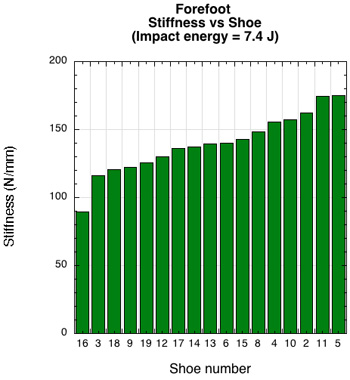
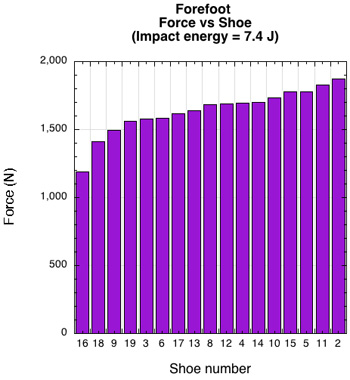
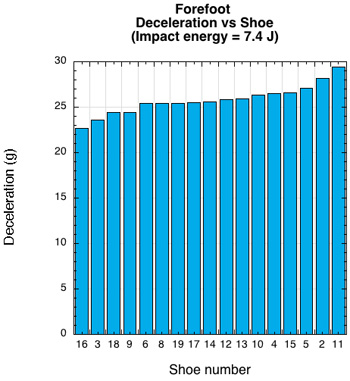
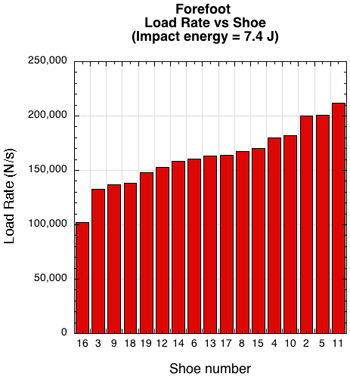
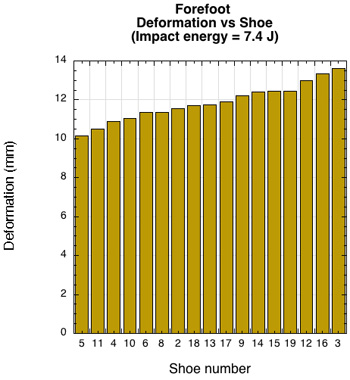
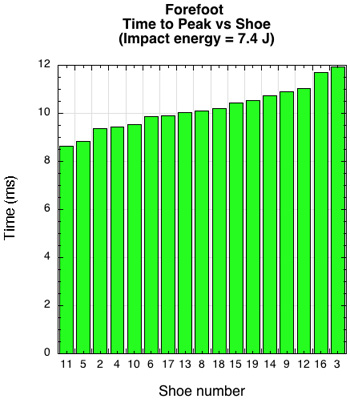
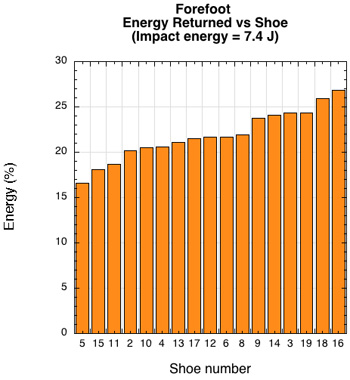
Figure 10 — Forefoot comparisons of all shoes in cushioning-related variables.
The graphs show that there are significant differences in all variables between shoes in both the heel and forefoot. Figure 11 displays the quantification of that difference for each variable. The bars in the graph are the ratio of the minimum value for all shoes to the maximum value of all shoes for each variable.
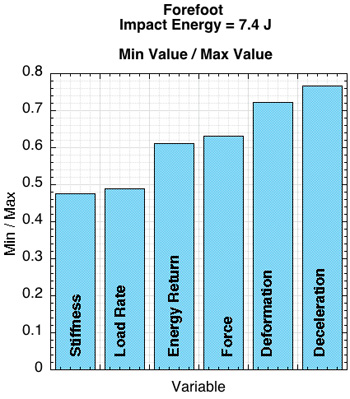
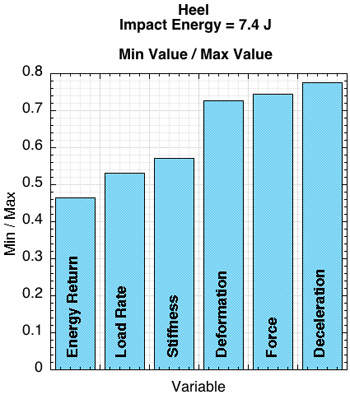
Figure 11 — Comparison of minimum to maximum values for forefoot and heel of impact variables of all shoes at an impact energy of 7.4 J.
If players adapt their movements to the characteristics of the shoe (or more specifically, to the shoe-surface interface), then the large range of variability in these characteristics implies the possibility of a wide range of adaptations, which in themselves may or may not be injurious or performance enhancing.
3.4. Normalizations and Predictions
Drop height to thickness normalizations. All the graphs of heels and forefeet and energy inputs can be normalized and collapsed onto one curve. If the ratio of drop height to shoe section thickness (q) and the product of drop height and thickness (q') are used as the independent variable, reliable predictions of force, deceleration, and deformation can be made (Figure 12) — note: impact energy can also be used in place of drop height.
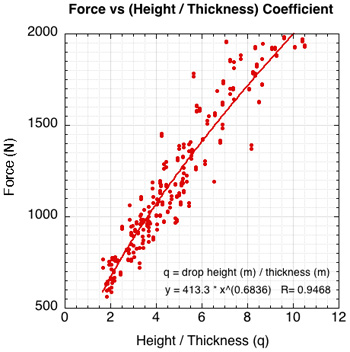
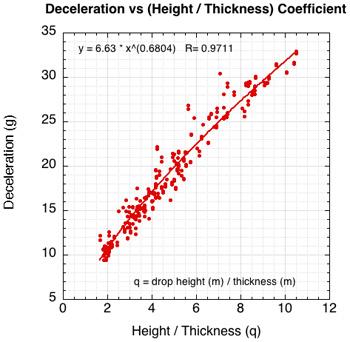
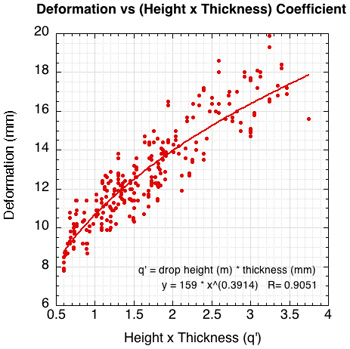
Figure 12 — Collapsing curves onto one normalized predictive curve using the ratio of drop height (or energy) to thickness and drop height times thickness. This allows predictions of force, deceleration, and deformation, independent of knowing any shoe properties.
The beauty of this procedure is that it is pre-experimental, requiring no measured experimental properties. It works well over the range of shoes tested, but it is not clear that it will extend over more shoes of various materials, constructions, and thicknesses. It uses shoe thickness as a proxy for stiffness, which may or may not be very accurate in all circumstances.
Stiffness normalizations. However, if we have done the experiment and know stiffness, then even better predictions can be made by normalizing stiffness by dividing (for force and deceleration) or multiplying (for deformation) it by drop height (or impact energy). Figure 13 shows the results.
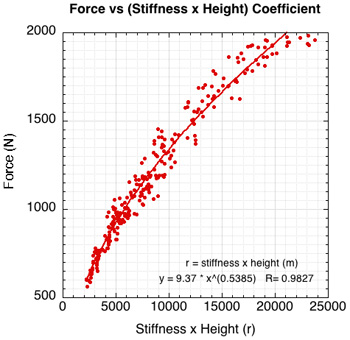
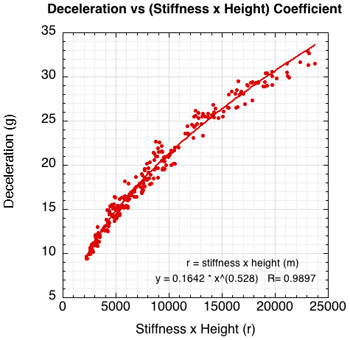
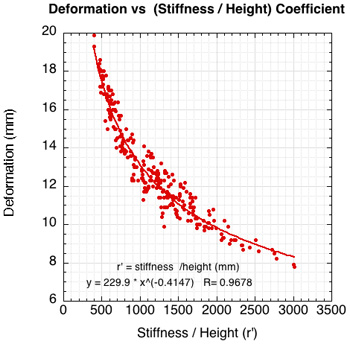
Figure 13 — Normalizing stiffness by multiplying (for force and deceleration) or dividing (for deformation) by drop height results in a collapsed singular power curve.
4. CONCLUSION
The main objective of this investigation has been to lay the scientific foundation for implementing a web-based interactive tennis shoe comparison database. Shoe behavior has been examined under different impact energies for several variables. Both heel and forefoot sections were analyzed. All shoes were compared to each other on all variables. It was found that there is a wide range of response between shoes for each variable. Given that players adapt their movements to the properties of the shoe, it is concluded that significant variations in movement and performance are possible depending on which shoe a player wears. It was also shown that approximate impact forces and loading may be estimated using calculations based on the ratio of impact energy to shoe thickness or impact energy times shoe thickness. Better estimates of forces are attainable using measured values of stiffness.
References
ASTM F1976-13 Standard test method for impact attenuation of athletic shoe cushiioning systems and materials. ASTM International.
Bobbert, M.F., Schamhardt, H.C., & Nigg, B.M. (1991). Calculation of vertical ground reaction force estimates during running from positional data. Journal of Biomechanics, 24-12, 1095-1105.
Cavanagh, P.R. & Lafortune, M.A (1980). Ground reaction forces in distance running. Journal of Biomechanics, 13, 397-406.
Clarke, J., Carre, M.J., Damm, L. & Dixon, S. (2013). The development of an apparatus to understand the traction developed at the shoe-surface interface in tennis. Journal of Sports Engineering and Technology, 227 (3), 149-160.
Clarke, T.E., Frederick, E.C., & Cooper, L.B. (1983). Effects of shoe cushioning upon ground reaction forces in running. International Journal of Sports Medicine, 4(4), 247-51.
Damm, L., Stiles, V., & Dixon, S. (2015). Human-shoe-surface interaction. Chapter in The Science and Engineering of Sports Surfaces, Routledge, 135-157.
Dixon, S.J., & Stiles, V.H. (2003). Impact absorption of tennis shoe-surface combinations. Sports Engineering 6, 1-10.
Hennig, E.M., Valiant, G.S., & Liu, Q. (1996) Biomechanical variables and the perception of cushioning for running in various types of footwear. Journal of Applied Biomechanics, 12, 143-150.
Hennig, E.M. (2011). Eighteen years of running shoe testing in Germany - a series of biomechanical studies. Footwear Science, 3(2), 71-81.
Lieberman, D.E. 2012. What we can learn about running from barefoot running: an evolutionary medical perspective. Exercise and sport Sciences Reviews,40(2), 63-72.
Luethi, S.M., Frederick, E.C., Hawes, M.R., & Nigg, B.M. (1986). Influence of shoe construction on lower extremity kinematics and load during lateral movements in tennis. International Journal of Sport Biomechanics, 2, 166-174.
Nigg, B.M., & Bobbert, M. (1990). On the potential of various approaches in load analysis to reduce the frequency of sports injuries. Journal of Biomechanics, 23, Suppl. 1, 3-12.
Nigg, B.M. (2001). The role of impact forces and foot pronation: a new paradigm. Clinical Journal of Sport Medicine, 11, 2-9.
Schwanitz, S., Moser, S., & Odenwald, S. (2010). Comparison of test methods to quantify shock attenuating properties of athletic footwear. Procedia Engineering 2, 2805-2810.
Shih, Y., Lin K., Shiang, T. (2013). Is the foot striking pattern more important than barefoot or shod conditions in running? Gait & Posture, 38, 490-494.
Shorten, M.R. (2000). Running shoe design: protection and performance. Marathon Medicine, London Royal Society of Medicine, 159-69.
Shorten, M.R. (2002). The myth of running shoe cushioning. Abstract of keynote lecture given at the IV International Conference on the Engineering of Sport, Kyoto Japan, 2002.
Shorten, M.R., & Mientjes, M. (2011). The effects of shoe cushioning on impact force during running. Footwear Science, March 2011.
Starbuck, C., Damm, L. Capel-Davies, J., Clarke, J., Carre, M., Stiles, V., Miller, & S., Dixon, S. (2013). Examining player perceptions and human response to tennis surfaces and the influence of prior clay court experiences. XXIV Congress of the International Society of Biomechanics, 2013.
Stiles, V.H., & Dixon, S.J. (2003). The biomechanical assessment of tennis surface cushioning properties during a tennis-specific movement.
Stiles, V.H., & Dixon, S.J. (2006). The influence of different playing surfaces on the biomechanics of a tennis running forehand foot plant. Journal of Applied Biomechanics, 22, 14-24.
Tam, N., Wilson, J.L.A., Noakes, T.D., & Tucker, R. (2014). Barefoot running: an evaluation of current hypothesis, future research, and clinical applications. British Journal of Sports Medicine, 48, 349-355.
Wright, I.C., Neptune, R.R., van den Bogert, A.J., & Nigg, B.M. (1998). Passive regulation of impact forces heel-toe running. Clinical Biomechanics, 13,521-31.