ABSTRACT
How Strings "Go Dead" — Part 1 dealt with several ways that strings, as players say, "go dead," including increased inter-string friction, decreasing longitudinal and perpendicular stiffness, increasing dwell time and deflection, and decreasing tension. All these effects have performance consequences. But there's another factor that peppers players' descriptions of string death — loss of elasticity due to an internal fatigue and breakdown of the string. This is often the explanation of players who experience string death as a loss of power. But is it true? Here we will examine the nature of elasticity, examine how it relates to power (in the player's meaning of shot speed), energy loss, and tension loss. The experiment described below shows that there is a decrease in rebound speed as string tension decreases with use, but this decrease is minimal in normal ranges of play. The experiment also shows that there is a relatively high energy return even when string tension is zero due to the stiffness of the string.
INTRODUCTION
String Structure
Elasticity is the ability of the material to return to its pre-stretched length. Resilience includes the notion of how quickly and with how much force it returns. Elasticity and resilience are included in a measurement of energy return. It is obvious that the strings return to length after every hit, otherwise the stringbed would look like a butterfly net. On the other hand, string does also deform. This is obvious to anyone who has strung a racquet. To pull the string to tension, you have to stretch it, and when you remove the strings from the racquet, the string remains at its stretched length, as opposed to its original length. Why does stretch occurring during impact return to its starting length but stretch during stringing does not? Secondly, is this elastic return a mirror image in time of the stretch, or does it occur along a different force-elongation path?
Part of the answer lies in the structure of the string. Synthetic tennis strings are extruded, drawn plastics. They are made of molecules known as polymers, which are very long chain molecules. They are chains of many ("poly") repeating units ("mer") — i.e., "polymer." Each repeating unit is an organized group of six to a dozen or so atoms composed, first, of a carbon backbone, as well as others like hydrogen, oxygen, and fluorine. These unit groups, also known as "monomers," are chemically arranged as, for example, ethylene, styrene, propylene, or amide. Hence, when strung together, we get polyethylene, polystyrene, polypropylene, and polyamide. Thousands and millions of these monomers are chained together like beads in a necklace, held together by strong covalent bonds (atoms sharing electrons) between them. The total length is very important because it helps to determine stiffness, strength, and elasticity. Adjacent polymer chains are bound to each other by much weaker secondary forces — hydrogen and Van der Waals forces — which behave more as electrically attractive forces rather than chemically uniting ones. The covalent bonds will not break but the secondary bonds are easy to break. The longer the polymer chains, the heavier they are (you often hear of string materials as "high molecular weight"), the more cross-link bonds they have with neighbors, and the more they entangle.
That is the first defining characteristic of synthetic string composition — very long, strong chains loosely attracted to each other. The second characteristic is the architecture of the chains. In general, these chains are not lined up end-to-end parallel to each other along the length of the string. Some random sections throughout the string are organized this way, but most of the chains are entangled around each other like a plate of spaghetti. When you dive in with a fork, some noodles will come out straight, some looped, and some knotted. They will be slipping, sliding, untangling/tangling, coiling, stretching and compressing with respect to each other. The noodles align themselves as best they can in the direction of the fork pulling them, but it is a messy affair, just like inside a string.
Viscoelasticity
String is viscoelastic. That means that it is part viscous and part elastic. The elastic element behaves as you expect, returning most of the energy. The response of the viscous part depends on the loading time. If you put a weight on the end of the string and leave it for a long time, it keeps stretching or flowing. This is what we call creep and it is due to the viscous nature of the string. It has plenty of time to perform its slow-motion flowing. Chains begin to unfold, slip, slide, and untangle relative to each other. But when you impact a string with the test impact hammer, the typical dwell time is anywhere from 25-40 ms. And when you hit the strings with a tennis ball, the dwell time is about 5 ms. This is not enough time for the viscous behavior to do much. Instead the string behaves almost totally elastic as only the straighter sections of the elastic chain backbones have time to contribute to the resistive rise in tension.
When you pull a string to tension before clamping it off, there is enough time for some creep to occur. When you clamp off, the string is then a fixed length, at which it stays until you cut the strings out. It does not creep. Instead, it undergoes stress relaxation (tension loss). This is just the other side of creep. In creep, you pull at a constant stress and the string keeps elongating. In stress relaxation, you pull to a certain length, and then stress declines — the chains slip and slide back to a lower stress equilibrium. The string stays the same length but all the internal bits and pieces move to the lowest electrical energy states available to them.
When you pull a string slowly both the elastic and viscous behaviors appear. The elastic response is an immediate response of each chain's bonds to restore the chain to its resting length. Virtually no energy is lost in the process. The viscous response is quite different — it is like slowly pulling a spoon out of a jar of honey. Layers of honey stick to each other a distance from the spoon. As you pull the spoon, the closest layers stick to it and layers further out begin to slide off and return to the lowest energy state provided by the volume of the jar and the force of gravity. But during the pull, all the slipping and swirling honey streams lose energy as heat while overcoming the frictional forces between the streaming layers of honey. If, on the other hand, you were to give a hard, short pull to the spoon, you would feel a counter force that felt like a tug. This is like an impact. For that very short period, only the elastic forces got involved and little flowing occurred.
That is an imperfect example but it evokes an intuitive recognition of what might be happening in the string. In the string, the straight chain sections make up the elastic mechanism and the folding/unfolding chain sections along with the sliding/rubbing of adjacent chains compose the slow-moving viscous mechanism. This unfolding, sliding and rubbing creates friction and the work done creating it is lost as heat — the string literally heats up. Because of this energy loss, when the load is removed, the string will not return as quickly or with as much force. And if the force were exerted slowly, the string will not return to its original length. It will be longer.
The difference between an elastic and a viscoelastic response can be observed by testing a string both dynamically and statically. Figure 1 shows a force vs elongation curve for a polyester string stretched relatively slowly at four pull rates, each performed with a new length of string. Graphs such as these are called "hysteresis curves." Hysteresis is measure of energy losses and return. Strictly speaking, it refers to a lag in the system when the deforming forces are changed. This is clearly demonstrated in Figure 1 where the return path of the string lags behind the stretch part of the curve. At each force level on the way down, the string stays stretched (lags) further than the same force stretched the string on the way up.
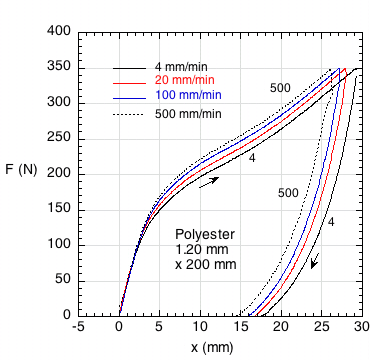
Figure 1 — Hysteresis in a slow stretch for 4 different stretch rates. (Image and test compliments of Rod Cross, University of Sydney, Australia.)
A number of observations jump out from Figure 1. First, all four curves start along the same path. This is the elastic portion of the stretch. Viscous response begins when the paths separate. The slower the stretch, the more the string stretches at each force. Said differently, the faster stretch is stiffer. Viscous flow has less time to occur for each force level. Another very apparent occurence is that the string does not return to its original length. It has suffered plastic deformation. This occurs because almost all viscous flow is irreversible. The faster stretches had less deformation than the slower ones. And last, though not obvious, the area between the up and down curves is the lost energy. Energy is force times distance. So the area under the upward curve (FxD) is energy used to stretch the string, and the area under the return curve (from the curve down to the horizontal axis from about 15 to 30 mm) is the energy used to return the string. All the area between the two curves was lost, not returned.
What happens if the stretch is much faster that those in Figure 1? A Babolat Pro Hurricane polyester string was placed in the test apparatus described in "How Strings Go Dead — Part 1" and impacted in the normal way. The string was tensioned to 52 lb and impacted 20 times to stabilize the string. The resulting hysteresis curve is displayed in Figure 2.
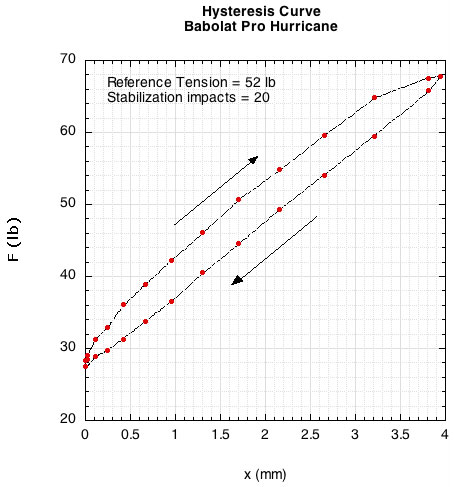
Figure 2 — Hysteresis for a polyester string during a 30ms impact with a test hammer.
The curve is quite straight, not exhibiting a viscous flow transition. The forces (tensions) are much higher and the stretch much less than for slower stretches of Figure 1. The string is much stiffer in this time domain of about 30 ms. The string also returns to its original length. Consequently, the energy lost area is a very thin region between the two curves. Instead of the string returning to a length longer than the original, it returns to a tension that is less. In fact, at each elongation distance the tension is less on the return curve than on the stretch curve. Figure 3 shows that the return time is also about 6% longer than the stretch time.
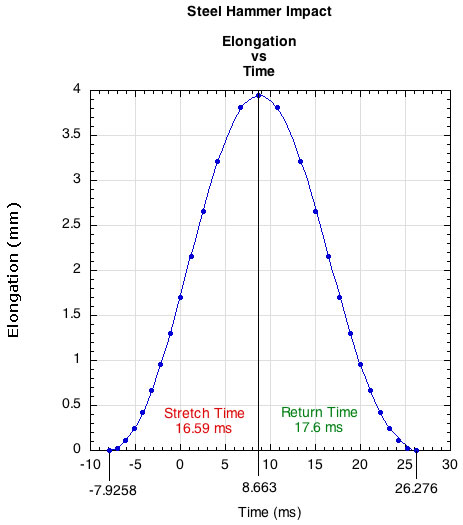
Figure 3 — Stretch time and return time in a 34.2 ms impact with a steel hammer.
The longer return time is true of all strings. The string simply does not snap back as fast as it deflects. It is built into the dwell time of every hit. The difference in stretch to return time increases the more the string stretches — i.e., when the tension declines and the string stretches further. Figure 4 shows the percentage of return time to stretch time vs pre-impact tension. The different colors represent strings that were initially strung at different reference tensions (not strings that were strung at a high tension and lost tension).
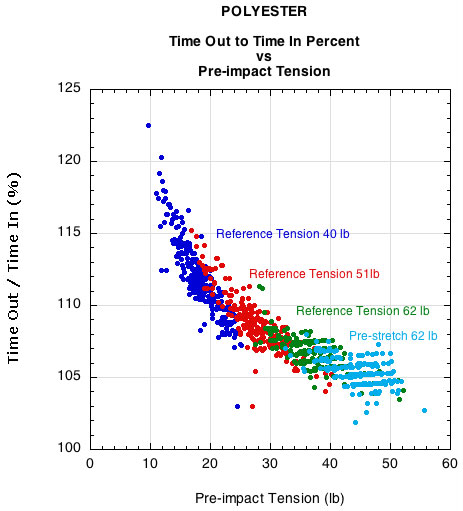
Figure 4 — Stretch time and return time for all polyester strings impacted with a steel hammer and tensioned at 3 reference tensions (62, 51, 40 lbs.) and 1 pre-stretched string tensioned at 62 lb.
If we were able to capture this same information during an impact of a tennis ball and a racquet, we would see a straighter and narrower up-down hysteresis curve. That is because the time of impact is typically between 4 and 7 ms, depending on the impact location, racquet weights, and impact speeds. In these high speed impacts, the energy is lost due to inter-chain friction and bond breaking (of the weak hydrogen bonds between chains).
(Note: for much more on the structure and behavior of strings see Chapter 27: "String Chemistry: Where Do Baby Strings Come From" in the book, The Physics and Technology of Tennis by Brody, Cross, and Lindsey)
THE EXPERIMENT
Loss of Elasticity and Resilience Tests
It is usually assumed that if there is a loss of elasticity and/or resilience, it is due to a combination of loss of tension and molecular degradation. What we need is an experiment that gets us "inside" the string. We need to look at impacts under abnormal conditions. Most players cut their strings out long before the tension gets below 20 pounds, but what if we measured performance by impacting strings until the tension was zero? Perhaps at zero tension we would witness a string not returning to its original length after impact or see energy return plummet to near zero levels.
A single piece of string was placed in the pendulum test equipment as described in How Strings Go Dead — Part 1. The tension was set at zero and the string was struck with the pendulum and the results measured. This was repeated 4 times. Then the same piece of string was pulled to 10 kg (22 lb). Impacts were performed until the tension decreased to zero and measurements were made every couple hundred hits or so. The string was again tensioned up to 10 kg and the tests performed as above. This cycle of tensioning, hitting, and re-tensioning was repeated 6 times (string broke during the sixth iteration). This procedure is summarized in Table 1.
| Table 1 Test Parameters | |||||
| Brand | String | Material | Re-tension Group Number | Reference Tension (kg) | Number of Hits |
|---|---|---|---|---|---|
| Tourna | Big Hitter Black 7 16 | Polyester | 0 | 0 | 4 |
| Tourna | Big Hitter Black 7 16 | Polyester | 1 | 10 | 900 |
| Tourna | Big Hitter Black 7 16 | Polyester | 2 | 10 | 1011 |
| Tourna | Big Hitter Black 7 16 | Polyester | 3 | 10 | 2000 |
| Tourna | Big Hitter Black 7 16 | Polyester | 4 | 10 | 2500 |
| Tourna | Big Hitter Black 7 16 | Polyester | 5 | 10 | 1100 |
| Tourna | Big Hitter Black 7 16 | Polyester | 6 | 10 | 200 |
Table 1 — String testing groups. The same length of string was repeatedly tested by hitting the indicated number of times and then re-tensioning to 10 kg (22 lb).
The aim of the experiment was two-fold: (1) to see what happens to string length and energy return as tension goes to zero, and (2) to see if there was internal degradation of the string. Any degradation would be ascertained by re-tensioning the string and measuring whether there was a decline in energy return or other properties as the string was again impacted at the same tensions. If the string were going to show signs of loss of resilience by not returning to its original length, surely this would occur when tension was zero and if it had arrived at zero by destructive impacts. If so, we would be able to see the string sag in the test rig. This did not happen. In fact, another string was latter put into the rig and hit 200 times at zero tension. It maintained its length throughout.
Figure 5 shows the energy return of each re-tension group relative to number of impacts. Each time the string was re-tensioned to 10 kg the energy return was greater than at the same number of hits as the previous re-tension iteration. In this way, the more we stretched the string via re-tensioning and impacts, the greater the energy return. However, within any re-tension group, the energy return tended to decrease with larger hit numbers, though the decline was less severe the more times we re-tensioned.
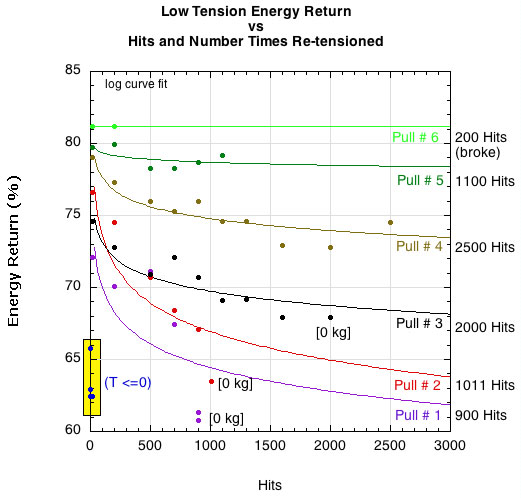
Figure 5 — Low tension energy return. String reference tension was 10 kg (22 lb) and hit until tension declined to zero or as low as patience allowed. After reaching the lowest tension measured, the string was re-tensioned to 10 kg and the test repeated (labeled as "pull number"). This was repeated 6 times.
Figure 6 is shows energy return vs tension of each group. The tension maintenance improved with each re-tensioning. Each group began at 10 kg and each successive group's impacts occurred at higher tensions and with greater energy return, no matter how many times we hit it.
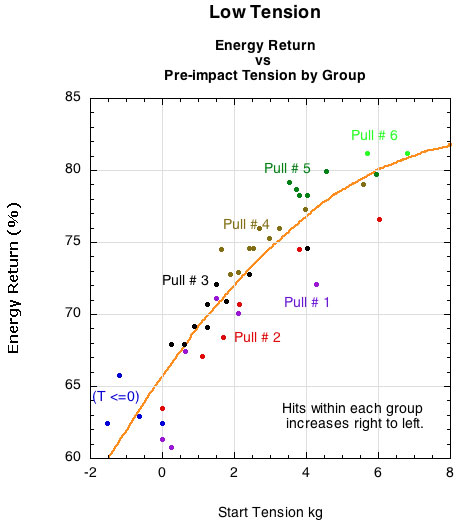
Figure 6 — Energy return vs starting tension.
Figure 7 shows essentially the same thing with regard to energy return vs stiffness. The string gets stiffer with each re-tensioning to 10 kg and the energy return is typically higher for the stiffer pull numbers.
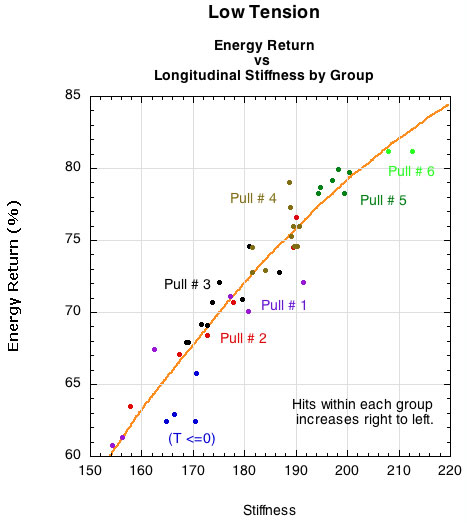
Figure 7 — Energy return vs longitudinal stiffness.
Figures 8 and 9 show that the energy return is greatest when deflection and dwell time are least, both within and between groups. Stretching the string further and for longer time decreases the energy return. It is not that we have reached an area where viscous behavior has set-in, however. Chains still can move relative to each other creating friction, and they more readily do so when the tension is lower. Some chains will untangle and uncoil some, even it they are not directly involved in tension production at these low tensions. This will lose energy.
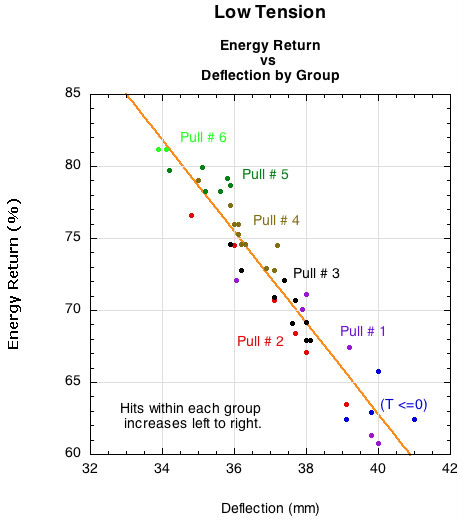
Figure 8 — Energy return vs deflection.
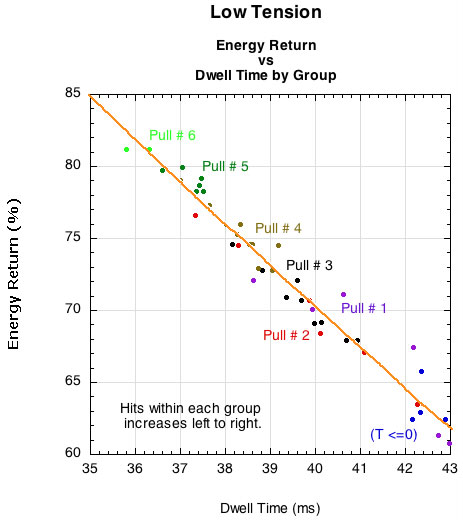
Figure 9 — Energy return vs dwell time.
A hysteresis curve helps visulize what is happening with these re-tensioned impacts. Figure 10 shows a force (tension) vs elongation curve for polyester string tested at a slow strain rate. After the first stretch, the string was 15 mm longer so it was removed from the clamps and repositioned until straight and then re-tensioned in the second stretch. The second stretch exhibits a profound decrease in engery loss.
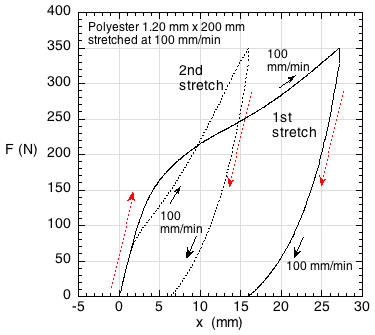
Figure 10 — Hysteresis curves for a normal and pre-stretched string. (Figure compliments of Rod Cross, University of Sydney, Australia)
ANALYSIS AND DISCUSSION
In a sense, it would appear that the string actually gets better with use, but you just have to re-tension it to get the benefit. Strings do lose more energy with more impacts and decreasing tension. That is mainly from increased friction within the string due to chain reconfigurations as opposed to chain degradation and breakage. But what does losing energy mean?
Energy return is determined as follows: the speed of the hammer just after leaving the string divided by the speed of the hammer just before initial contact. This is what is known as the coefficient of restitution (COR) or, in tennis terms, the power potential. If you use these ingoing and outgoing velocities in the energy equation E = .5mv2 and divide the outgoing energy by the ingoing energy, you have the energy return. This is measured perpendicular to the string.
But the energy return of the string in the test apparatus is not the same as the energy return of the ball-string interaction. The pendulum test is designed to measure only the string properties. To do that we have to make sure, as much as possible, that all of the energy of impact goes into the string. That is why a steel hammer head is used. It will not deform enough to absorb any significant amount of energy, so the kinetic energy of impact all goes into the string, whereupon most gets stored as elastic energy, some gets burned up in friction-induced heat, and some small amount also gets lost in test rig vibrations. In this way we can measure the efficiency of each string. Balls are measured in a similar way using a concrete floor or wall as the impact device directing all the impact energy into the ball so that ball efficiency can be measured.
Energy Flow
But a ball-racquet collision is different. When a ball and a racquet collide, the impact energy gets transmitted and absorbed all over the place. Some energy goes into the ball as deformation, some into the strings as stretching, some into the racquet as vibration and some into altering racquet motion such as translating, rotating, and twisting. Virtually all the energy that goes into altering racquet motion and vibration gets lost. That is why the mass and its location is so important to power.
But most of the kinetic energy is in the swinging racquet and it remains there throughout the impact. Only a certain amount of its pre-impact energy is converted into elastic energy in the strings and ball. The amount will depend on several things: the relative stiffness of the stringbed to the ball, the relative speeds of the racquet impact location and ball, the energy return characteristics of the string and ball, and the hittingweight (effective mass) of the hitting location. All of these factors will determine how much energy stays in the racquet, how much goes into the ball, and how much goes into the strings. They will also determine how much energy the strings and the ball will each return to the final ball energy.
All of this can be calculated. Figure 11 shows the results of such a calculation. Input parameters were varied while keeping others constant in order to see how the results changed with the varying inputs. The input parameters were these: initial ball and racquet impact point velocities, effective mass (hittingweight) of the impact location, relative stringbed and ball stiffness ratio, and the energy loss variable of strings and balls. The ball typically loses about 45% of the energy that goes into it, so that was kept constant. The energy loss characteristics of string will vary with stringbed stiffness and tension.
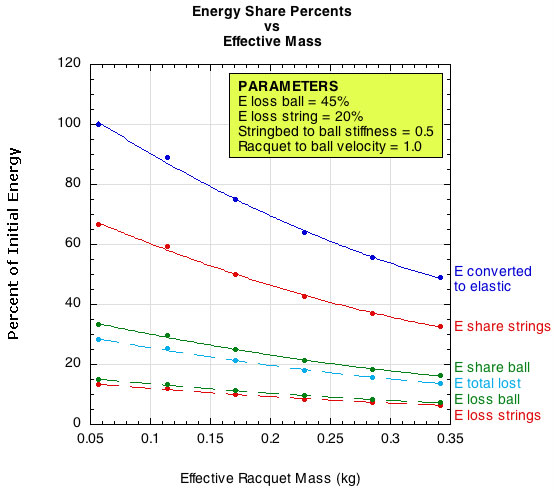
Figure 11 — Elastic energy conversion and loss.
The horizontal axis is effective mass. This is the effective mass of the hitting location, also known as the "hittingweight." The entire weight of the racquet does not come into play on a hit unless the ball hits exactly at the center of mass. For all other impact locations, the impact point will rotate, twist, and translate backward depending on how far the impact point is from both the long axis from tip to tail and the perpendicular axis at the center of mass. The further from the axes, the faster the racquet will recoil, as if it were lighter — thus, its "effective" mass. As a rough approximation, the effective mass is typically about one third the actual weight at the tip, one-half in the center of the strings, and 100% at the balance point. So, a 340 gram racquet would have an effective weight of about 170 grams in the center and 113 near the tip.
In Figure 11, the most realistic parts of the curves for actual play are between 0.1 and 0.2 on the horizontal axis. This represents about a 7% difference in energy loss between those two masses. As effective mass gets much higher, the curves start to flatten out. That is because the effective mass becomes much greater than the ball, and the racquet just plows through the ball, barely noticing its existence at very high effective mass. Figure 12 shows this clearly. It shows that racquet and ball velocities are radically affected at lower mass, but as mass increases, the racquet becomes "as a wall" to the ball, and velocities become virtually constant, no matter how much the racquet weighs. In this graph, the realistic hitting weight is only around the very first tick on the horizontal axis.
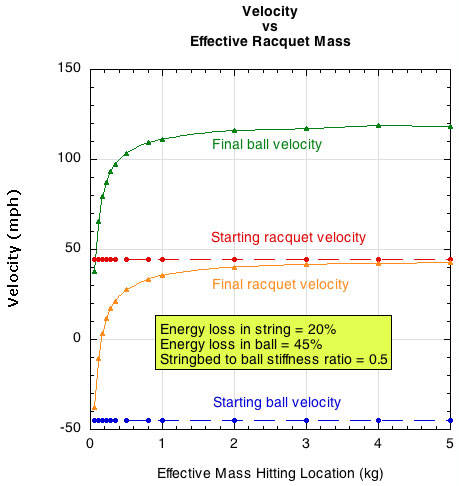
Figure 12 — Ball and racquet velocities after impact depending on effective racquet mass.
The relative stiffness of the stringbed is important because more energy will be directed into the softer object. To get the most energy return, you want the most energy to go into the object that loses the least amount of energy during its deformation. If the stringbed and the ball are equally stiff (which is a good approximation for a new string job), they will each receive half of the energy that is converted into elastic energy. If 75% of the original kinetic energy of the ball and racquet impact location is converted, and if the strings tend to lose 20% and the ball 45% of the energy they receive, then the total loss for the strings will be 20% of 50% of 75% (7.5%) and the ball will lose 45% of 50% of 75% (16.8%) of the total starting energy. If, on the other hand, the stringbed is half as stiff as the ball, then the strings will receive 66.7% and the ball 33.3% of the converted energy (use 75% again). Then the strings will lose 20% of 66.7% of 75% (10%) and ball will lose 45% of 33.3% of 75% (11.2%). These relationships are depicted in Figure 13 for a racquet with effective mass of 171 grams.
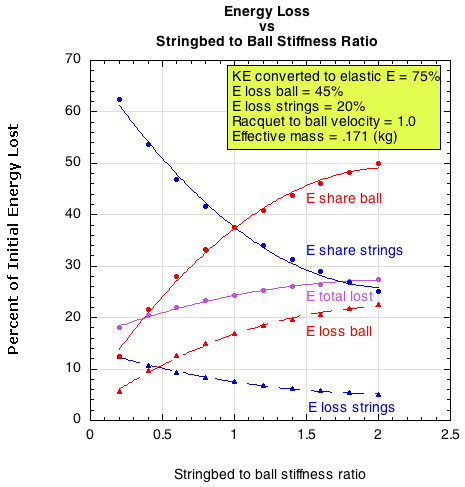
Figure 13 — How stringbed stiffness affects energy flow.
As the stringbed stiffness increases, more energy is directed into the softer ball and less into the strings. Because more energy goes to the ball and because the ball loses more of the energy passed to it, the ball energy loss curve increases with stringbed stiffness. The strings will receive less energy and lose a smaller percent of that, so the energy loss in the strings go down. But the combined loss of more ball-loss plus less string-loss is an increase in total loss as the stringbed gets stiffer.
The relationship between the curves in Figure 13 would change if the energy loss characteristic of the string changed, as when the string is losing tension with use. Figure 14 shows how ball velocity changes with changes in both stringbed stiffness and string energy loss. This data is for incident racquet and ball speeds of 45 mph and a impact location with effective mass of 171 grams. Figure 15 is essentially the same graph with ACOR (apparent coefficient of restitution) as the vertical axis. ACOR, or "power potential," is independent of the relative velocities of the ball and racquet, so it is a more generalizable indicator.
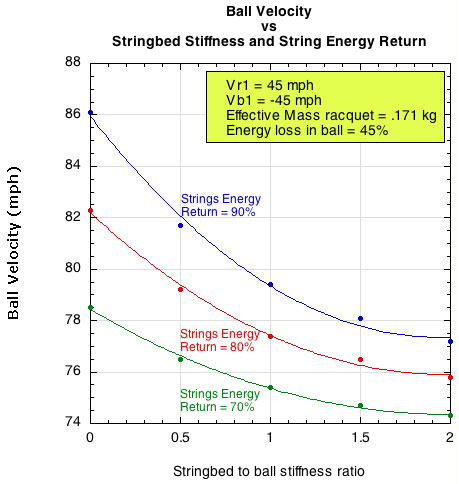
Figure 14 — Changes in ball velocity with changes in stringbed stiffness and energy return of the string.
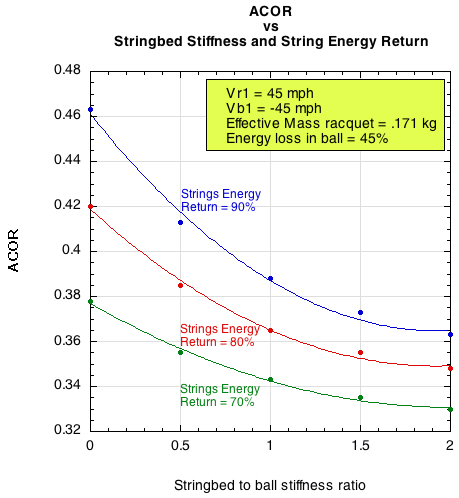
Figure 15 — Changes in ACOR with changes in stringbed stiffness and energy return of the string.
As the number of impacts increases, a polyester string loses tension. As tension decreases, both stringbed stiffness and string energy return decrease. To estimate a result of such changes in Figures 14 and 15, you would simply make a move from one curve to another by moving diagonally down to the left. For example, in Figure 14, starting at the point on the blue curve at stringbed stiffness of 1.0 and moving diagonally to the red curve, you might lose 1 mph. And if you continue to the green curve you might lose another 1 or 2 mph. That is not a large difference in speed, and those are probably larger jumps in both stingbed stiffness and energy return than a player would experience during play.
The reasoning applies to making the same move on Figure 15. Depending on the angle of your diagonal move from the blue to the red curve, the change in ACOR might be about 0.02-0.03. You can apply this number in a generalized way to any impact by the ball speed formula: Vbf = ACOR(Vr1 + vb1) + Vr1, where Vbf = the final ball velocity and Vr1 and vb1 are the initial racquet and ball velocities. Vr1 + vb1 is the impact velocity. So, for a given impact speed, just multiply the change in ACOR by the impact velocity and you will have the difference in ball velocity. In our example of the Vr1 and vb1 as 45 mph each, then 0.02 x 90 = 1.8 mph and 0.03 x 90 = 2.7 mph.
Another big picture view of energy loss and velocity is shown in Figures 16 and 17. This shows the change in energy and velocity for a specific shot (racquet and ball impact speeds of 45 mph, effective mass of 171 grams, and energy loss in string of 20%). Likely playing scenarios would be between 0.5 and 2.0 stringbed ratio, and even though that is the steepest part of the velocity curve, the change in velocity between those values is only 2-3 mph or 0.03 ACOR.
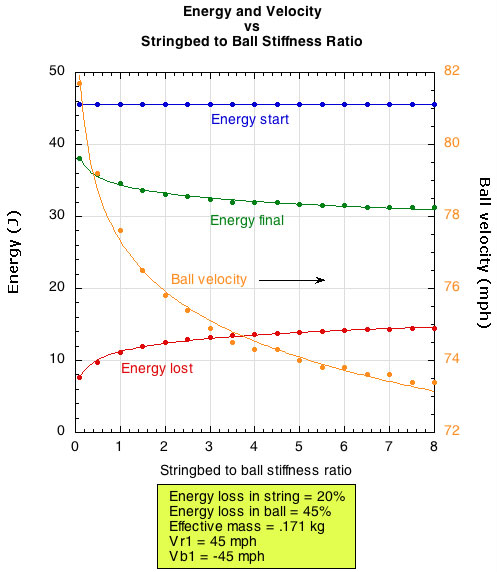
Figure 16 — Changes in energy and ball velocity with changes in stringbed stiffness.
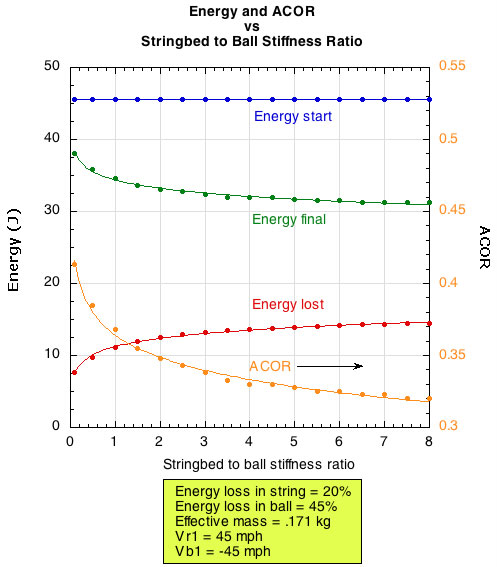
Figure 17 — Changes in energy and ACOR with changes in stringbed stiffness.
Figures 11-17 demonstrate that large changes in stringbed stiffness or energy return properties does not lead to large changes in ball velocity. Figures 6 and 7 showed that even at zero tension, a string maintains a relatively high stiffness (160 lb/in in this case) and energy return (60-65%). In other words, string is pretty stable when it comes to energy return over normal playing ranges.
CONCLUSION
During a tennis hit there is very little energy loss. Upon repeated impacts, energy loss increases slightly as tension declines, stretch increases, and dwell time is increased. For normal ranges of play, only 1-3 mph difference might be expected in ball velocity as the string's energy return decreases.
The polyester string tested had a significant energy return even when the tension was set to zero. The inherent stiffness of the string was enough to maintain string length and resiliency.
Pre-stretching has a significant influence on energy return. Pre-stretching increases stiffness and energy return while decreasing deflection and dwell time. This is because the previous stretches realign the polymer chains in the axial direction, removing some of the viscous play normally evident in the unfolding and sliding of chains.
Although the decrease in energy return does not affect ball velocity much, it probably amplifies the effect of increasing friction between strings. Lateral movement of the mains is inhibited by the increased friction and the decreased energy available to overcome that friction. The combined effect is what players experience as the increased stiffness and decreased response of the stringbed.
String is never in the same internal state from one impact to the next. It is never in the same state from one second to the next. For that reason, the performance of the string depends on its previous history. It is in a constant state of transition from where it has been. In a strung racquet, this internal state manifests as stress relaxation — i.e., tension loss. And the loss of tension results in more stretching which, by its nature, involves more energy loss due to more internal friction. This could be considered an "internal degradation" of resilience. But it begins as soon as you string the racquet and with every hit. Instead, it is really just the nature of string. The inherent structure has not been compromised, only its current state. If you re-tension that same string, it performs "better" than before. That is because the internal structure has actually been "improved." But regardless of what you call it, the performance can be simply accessed by measuring the energy return or velocity of the ball. And this resulting velocity change due tension loss would appear as a minor player in a player's perception of more or less power in the string as it "goes dead." However, as discussed in How Strings Go Dead — Part 1, this loss of energy can amplify the decline in stringbed liveliness parallel to the stringbed.