1. ABSTRACT
As shown elsewhere — Spin and String Material, Spin and String Movement, and Spin and String Pattern — main strings that move sideways in the stringbed may, depending on circumstances, create more spin. To achieve maximum spin, you must get the string moving, keep it moving both to and fro, and do so quickly and with as little loss of energy as possible. Minimizing interstring static and sliding friction is essential to this process. But is static or sliding friction more important? Can a string or hybrid combination have a relatively high static friction and low sliding friction, or vice versa? Measuring these friction types is therefore necessary for comparing strings with respect to string movement and spin potential and for revealing promising avenues for further investigation into spin production.
2. INTRODUCTION
There are several varieties of friction that influence the spin of the ball: the sliding friction between the ball and the strings, the static friction between the ball and the strings at the grip phase, the static friction between the main and the cross strings, and the sliding friction between the strings. The first three have been dealt with elsewhere (Static Friction and Spin and String-to-Ball Friction), so we will concentrate on sliding friction between strings here. Friction of all types depends on the perpendicular force ("normal" force) pushing the surfaces together and the coefficient of friction (COF). The generalized formula is:

Where,
F is the friction force
μ ("mu") is the COF
N is the normal force
It is the same formula for static, sliding, or rolling friction, except that in each case the COF will be different. To identify which friction is being talked about, the subscripts k, s, r are used on both the F and μ terms to designate kinetic (sliding), static, or rolling respectively.
The COF is the constant of proportionality between the friction force and the normal force. It is not a theoretical number and can only be determined by measurement. It primarily depends on three things: the atomic attraction (adhesion) between surface materials, the microscopic topography of the contacting surfaces, and the relative deformation of the two surfaces. This latter determinant is not a consideration with hard materials. That is why you will often hear or read that friction does not depend on the surface area in contact. This premise is based on how the contacting atoms attract each other. For a hard object of a given weight and shaped, say, like a book, the attraction will be the same whether you place it on a hard surface on its spine side or flat side. When on its spine side, fewer atoms will be in contact, but each will be closer to the other because more weight is concentrated over a smaller area. On the flat side, more atoms will be in contact, but each will be further apart and not attracting each other as much because the weight is spread out over a larger area. But if the materials deform either macro- or microscopically, then more atoms become squished together, creating a greater adhesion. Furthermore, when one or more of the surfaces deforms, the surfaces fit together as hills and valleys. These must be either climbed or plowed through. That increases the friction and makes movement more difficult.
Static friction is the force resisting movement of two surfaces against each other when a force is applied to one or both of them in a direction tangential to their contacting surfaces. It is a "self-adjusting" force in that, up to a maximum applied force (where movement is initiated), the static friction force opposing motion will increase to match the applied force. It is at this maximum value that the coefficient of static friction is measured. Static friction is the force that holds the strings in place when you push against a string with a force that is less than that of the maximum static friction force. Static friction will push back with the exact same force that you push on the string — up to a point. As soon as you push harder than the maximum static friction force, the string will move on the other. Once movement has been initiated, it becomes easier (less force required) to keep the string moving than it was to initiate the movement. At this point, static (i.e., no movement) friction is replaced by sliding friction (also known as kinetic friction). Sliding friction is almost always less than the maximum static friction. Nonetheless, it will act to limit the distance and speed of the string movement (which involves stretching and storage of elastic energy).
As the string stretches sideways, it will increase in tension. Also, as the ball compresses more into the string, the force pushing the ball and string together increases, and the sliding friction increases along with it (as per Equation 1). At some point the combined effect of increased tension and sliding friction will halt the tangential stretch of the string, which has stored all the energy used to push it that was not lost in inter- and intra-string friction, ball deformation and sound. This elastic energy will try to restore the string to its original position. But on the string's return journey, it must once again overcome static friction (which reappears at the turnaround point when the string speed is zero) and sliding friction. The string may stay stuck and held by the ball until the ball rebounds enough to lessen the normal force between strings, allowing the elastic energy to break the static friction and begin its slide back into position.
As the string snaps back, it exerts a torque on the ball, increasing the spin. The spin increase will depend on how far and how fast the string snaps back (will depend on sliding friction) and when it does so. The snap-back must occur while the ball is pressing hard enough against the string to generate enough friction and torque to significantly change the ball's spin. That means the snap-back must occur before the center of the contact area has slid too far past the stretched string or before the ball has progressed too far into the decompression phase of the bounce.
3. THE EXPERIMENT
Figure 1 shows a device constructed to measure the sliding friction between strings. A weighted sled (with weight m1) with two string "rails" attached to its bottom is accelerated down incline ramps by mass m2 to a known maximum speed (measured by analyzing 420 fps slow motion video) and sent sliding onto two string "rails" on a horizontal slide. The speed of the sled was varied by releasing the sled from various predetermined starting distances on the ramps or by changing the mass m2. The ramps for the front and back wheels are inclined at different angles and the front and back wheels are of different sizes. The combination allows the sled to remain horizontal throughout its descent and to land the front and back strings at the same time. The sled's and slide's string "rails" were perpendicular to each other so the sled's strings moved as if they were main strings moving across the crosses on the slide. The strings were anchored at each end and the longer slide strings were pulled to 30 lbs tension and the shorter sled strings pulled to 20 lbs tension. Simultaneous with mass m2 hitting the floor, the front and back wheels of the sled take off from the ramps and the front and back sled strings simultaneously touch down on the slide strings. At this point, the only force acting on the sled is the sliding friction between the main strings (the sled strings) and the cross strings (the slide strings). (Note: the sled main string will stretch slightly as it moves over the slide and it will increase the measured sliding COF as it moves back into place, but it is this exact movement we are trying to create, anyway.) This force progressivly slows the sled until it stops.
Figure 1 — Apparatus to measure sliding friction between strings.
Tests were done with different weights on the sled and with different initial sliding speeds. The distance from the beginning of the slide to the sled's termination was measured. Knowing the initial sliding speed and final sliding distance, the average sliding coefficient of friction could be determined using the Work/Energy formula:
Where,
F is the friction force
d is the stopping distance
v1 = initial sled speed on string slide
v2 = 0 if the sled comes to a stop
g = gravitational acceleration of 9.8 m/s2
Substitituting Equation 1 for F and mg for N, we get,
And solving for μ we arrive at the equation for the sliding COF:
Three to five trials were measured for each combination of string load and string speed and the results were then averaged.
4. ANALYSIS
Figure 2 is a graph showing a typical result. A nylon multifilament string, Wilson NXT Tour 17, was tested at multiple sled speeds at two different sled weights. As can be seen, for a given sled weight, the sliding COF increases with sled speed. For a given sled speed, sliding COF increases with weight.
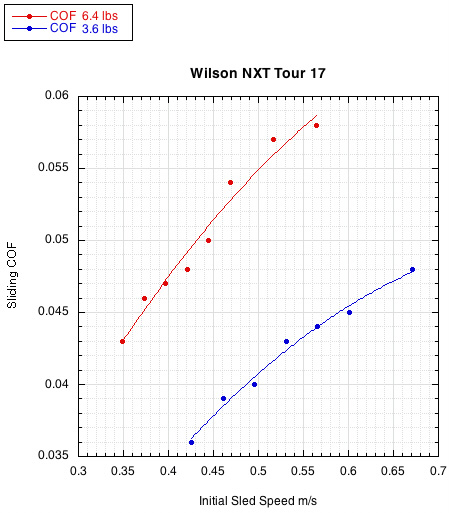
Figure 2 — NXT Tour Sliding COF. All strings displayed similar behavior. For a given load on the strings, the sliding COF goes up with the relative speed of the strings on each other ("sled speed" in the graph). For a given string speed, the sliding COF goes up with additional force pushing the strings together. The normal force for the red and blue curves was 6.4 lbs (28.3 N) and 3.6 lb (15.1 N) respectively.
The graph curves in Figure 2 demonstrate that the COF is not a constant number and depends on the experimental setup. There is no such thing as "THE" COF. However it is possible to compare strings for a given setup and, for most practical purposes, assume that the same relative values of string COFs will hold for a similar, non-extreme setup. To easily and conveniently compare the sliding COF of strings, just one string load and one string speed is chosen. For Figures 2-4, just the data for a string load of 2.89 kg (6.4 lbs) at all speeds is shown. For Tables 1 and 2 below, a single data point is chosen — a load of 6.4 lbs and relative string speed of 0.57 m/s (1.3 mph) (the upper red dot in Figure 2). In a tennis hit, if the string moves sideways, say, 5 mm in 2 ms, then its speed would be 2.5 m/s (5.6 mph).
Figures 3, 4, and 5 show various comparisons of string materials tested at a sled weight of 6.4 lbs. That is the red curve in Figure 2. Both the string load and string speed will be greater on an actual tennis hit, but it is difficult to replicate those forces and speeds in a mass produceable way in the lab. Of note, the string load used in the sliding COF tests was 1.6 lbs per string intersection. In the static COF tests it was about 13 lbs. Therefore, the sliding COF here is understated compared to what it would be if the sliding COF tests were also performed at 13 lbs per string intersection. However, the relative relationships of COF values for comparing strings should be roughly the same. The only time this would not be the case is if, within the range up to 13 lbs, a string reaches a threshold where material deformation occurs at an increasing or decreasing rate compared to lesser string loads.
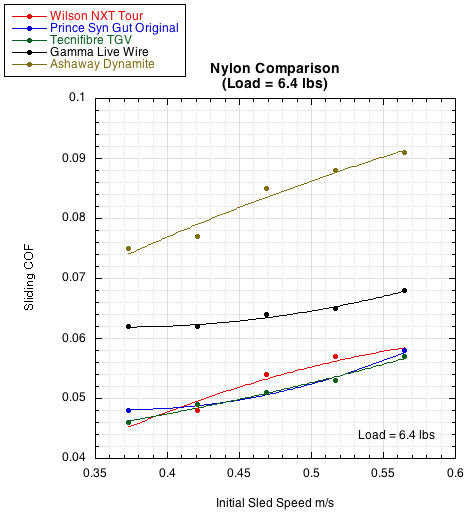
Figure 3 — Nylon Comparison. The curves show the extremes of sliding COFs measured. Almost all COFs topped out below 0.07 at the fastest string sliding speed (right most dot on each curve). Only a handful were above 0.07, and the one shown here (Ashaway Dynamite) was the highest (it has a very textured surface). So the range of most sliding COFs is a narrow area between 0.04 and 0.07. This is shown more clearly in Table 1 below.
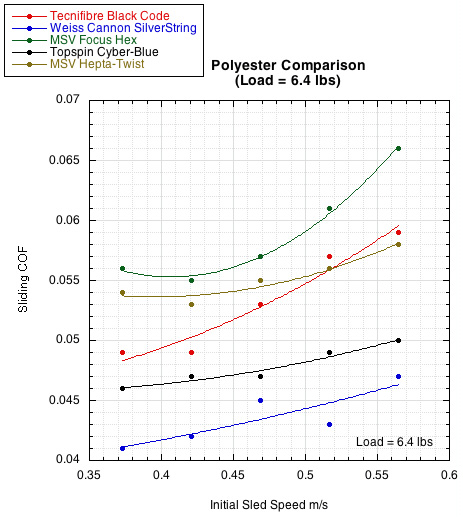
Figure 4 — Polyester Comparison. The polyesters have, on average, a lower sliding COF than do nylons. The polyesters with the highest COFs tend to have a shaped or textured surface. That is the case here. The two highest COF curves (green: MSV Focus Hex; brown: MSV Hepta-Twist) are both shaped strings. These relationships are also shown in Table 1 and Table 2.
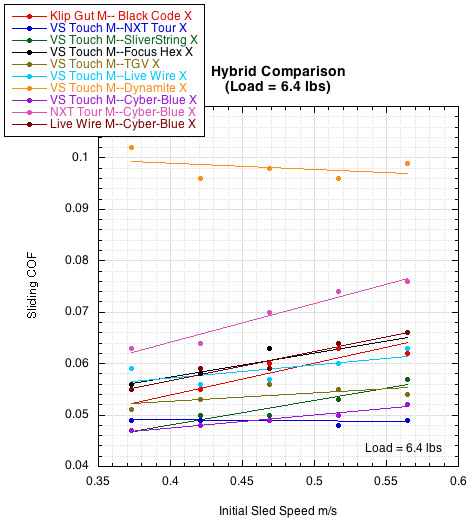
Figure 5 — Hybrid Comparison. Gut mains seem to be the secret to achieving the slipperiest combination. Polyester is next and then nylon. However, the cross string seems not to be so specific — both nylon and polyester alternate in the list of slipperiest combinations (see Tables 1 and 2). This is contrary to the case in static friction where we found the gut mains and poly crosses to be universally the slipperiest combination.
There is obviously a difference in COF between strings and combinations of string types, but most of the setups fall in a COF range between 0.045 and 0.065 over the range of relative string speeds tested. This range appears narrow, but low-to-high it is about a 45% difference. There is enough difference to affect performance. Some strings don't return to their starting position, some return too slowly, some don't have enough energy to add much to spin.
Table 1 lists several strings in order of their sliding COF (from low to high). Where available, the static COF is supplied as well as the percentage of the sliding COF to the static COF. Some interesting observations are immediately apparent:
- The sliding COF is generally about 40-60% of the static COF.
- Polyesters tend to have the lowest sliding COF.
- In general, strings with a low static COF will have a low sliding COF. Exceptions occur in the hybrids and for some PU coated and shaped/textured strings.
- Most shaped/textured strings gravitate to the bottom of the list (higher sliding COF).
- Hybrids are not at the top of the list like they are for static friction.
- Hybrids are not in any mains-crosses material combination order as they tend to be in static the static COF table. Though gut mains tend to be the slipperiest mains in hybrids, it is not as consistent a phenomenon as with static friction.


Sliding Coefficient of Friction
(Sorted by Sliding COF)
| Brand | String | Material | Shaped | Sliding COF | Static COF | COF Ratio |
|---|---|---|---|---|---|---|
| Babolat | Pro Hurricane Feel 16 | P | 0.04 | 0.089 | 44.9% | |
| SuperString | Viper V2 Rough 16L | P | X | 0.042 | 0.097 | 43.3% |
| Gamma | Zo Ice 16 | P | 0.044 | 0.102 | 43.1% | |
| Prince | Tournament Poly 16 | P | 0.044 | 0.09 | 48.9% | |
| Tecnifibre | xr3 17 | N | 0.047 | 0.159 | 29.6% | |
| Weiss Cannon | Silverstring 1.25 | P | 0.047 | 0.108 | 43.5% | |
| SuperString | Nikita Soft 17 | P | 0.047 | 0.085 | 55.3% | |
| SuperString | Nikita Original 17 | P | 0.048 | 0.109 | 44.0% | |
| MSV | Focus-EVO 17 | P | 0.048 | 0.098 | 49.0% | |
| Mantis | Comfort Polyester 16 | P | 0.048 | 0.092 | 52.2% | |
| Hybrid | Babolat VS Touch 16 M / Wilson NXT Tour 17 X | G-N | 0.049 | |||
| Weiss Cannon | TurboTwist | P | X | 0.05 | 0.117 | 42.7% |
| Topspin | Cyber-Blue 1.25 X | P | 0.05 | 0.09 | 55.6% | |
| Luxilon | Big Banger Timo 17L | P | 0.051 | 0.094 | 54.3% | |
| Gamma | Zo Power 16L | P | 0.052 | 0.132 | 39.4% | |
| hybrid | Baboat VS Touch M / Topspin Cyber-Blue 1.25 X | G-P | 0.052 | |||
| Signum Pro | Plasma Pure 1.23 | P | 0.053 | 0.106 | 50.0% | |
| Volkl | Power Fiber II 17 | N | 0.054 | 0.15 | 36.0% | |
| Tecnifibre | Pro Redcode 17 | P | 0.054 | 0.109 | 49.5% | |
| Hybrid | Babolat VS Touch 16 M / Tecnifibre TGV 16 X | G-N | 0.054 | |||
| Wilson | Enduro Tour 16 | P | 0.054 | |||
| Tecnifibre | X.Code 16 | P | 0.055 | 0.21 | 26.2% | |
| Signum Pro | Poly Plasma 16L | P | 0.055 | 0.098 | 56.1% | |
| Tecnifibre | E-Matrix 17 | N | 0.056 | 0.184 | 30.4% | |
| Gosen | OG Sheep MIcro Super 16L | N | 0.056 | 0.145 | 38.6% | |
| Polyfibre | TCS 1.25 | P | 0.056 | 0.098 | 57.1% | |
| Hybrid | Babolat VS Touch 16 M / Prince Synthetic Gut Original 17 X | G-N | 0.056 | |||
| Tecnifibre | TGV 16 | N | 0.057 | 0.239 | 23.8% | |
| Head | FXP Power 16 | N | 0.057 | 0.112 | 50.9% | |
| Hybrid | Babolat VS Touch 16 M / Weiss Cannon Silverstring 1.25 | G-P | 0.057 | |||
| Hybrid | Gamma Zo Ice 17 M / Babolat VS Team 17 X | P-G | 0.057 | |||
| Hybrid | Prince Tournament Poly 16 M / Babolat VS Team 17 X | P-G | 0.057 | |||
| Wilson | NXT Tour 17 | N | 0.058 | 0.18 | 32.2% | |
| Prince | Synthetic Gut Original 17 | N | 0.058 | 0.124 | 46.8% | |
| MSV | Hepta-Twist 16 | P | X | 0.058 | 0.085 | 68.2% |
| Tecnifibre | Black Code 17 | P | 0.059 | 0.118 | 50.0% | |
| Hybrid | SuperString Viper V2 Rough 16L M / Babolat VS Team 17 X | P-G | 0.059 | |||
| TopSpin | Cyber Flash 17 | P | 0.061 | 0.103 | 59.2% | |
| Hybrid | Klip Legend (uncoated) Gut 16 M / Tecnifibre Black Code 17 X | G-P | 0.062 | |||
| Wilson | NXT Max 16 | N | 0.062 | |||
| Babolat | VS Team 17 | G | 0.063 | 0.147 | 42.9% | |
| Tourna | Big Hitter Rough 17 | P | X | 0.063 | 0.13 | 48.5% |
| Hybrid | Babolat VS Touch 16 M / Gamma Live Wire 16 X | G-N | 0.063 | |||
| Hybrid | Head FXP Power 16 M / Babolat VS Team 17 X | N-G | 0.064 | |||
| Hybrid | Signum Pro Poly Plasma Pure 17 M / Babolat VS Team 17 X | P-G | 0.064 | |||
| Signum Pro | Tornado 17 | P | X | 0.065 | 0.139 | 46.8% |
| Gamma | Synthetic Gut 16 w/Wearguard | N | 0.066 | 0.13 | 50.8% | |
| MSV | Focus Hex 1.18 | P | X | 0.066 | 0.071 | 93.0% |
| Hybrid | Babolat VS Touch 16 M / MSV Focus Hex 1.18 X | G-P | 0.066 | |||
| Hybrid | Gamma Live Wire 16 M / Topspin Cyber-Blue 1.25 X | N-P | 0.066 | |||
| Tourna | Quasi-Gut 16 | N | 0.067 | 0.128 | 52.3% | |
| Gamma | Gamma Live Wire 16 | N | 0.068 | 0.145 | 46.9% | |
| Klip | Klip Legend uncoated Gut 16 | G | 0.069 | |||
| Kirschbaum | Spiky Shark 17 | P | X | 0.071 | 0.118 | 60.2% |
| Hybrid | Wilson NXT Tour 17 M / Topspin Cyber-Blue 1.25 X | N-P | 0.076 | |||
| Luxilon | Big Banger Alu Power Rough 16L | P | X | 0.081 | 0.127 | 63.8% |
| Isospeed | Professional Classic 17 | N | 0.087 | 0.207 | 42.0% | |
| Ashaway | Dynamite 17 | N | X | 0.091 | 0.278 | 32.7% |
| hybrid | Baboat VS Touch M / Ashaway Dynamite 17 X | G-N | 0.099 | |||
| Ashaway | Dynamite Soft 17 | N | X | 0.101 | 0.204 | 49.5% |
It is interesting how materials behave differently individually and in combination. It is especially interesting how a particular combination of a main and a cross can behave totally differently when the string types are reversed into the cross and the main. In this case you would assume that the adhesion forces are the same and the shape of the contacting surfaces are the same. So it seems that the relative deformation between main and cross is what matters in the differing movement between the strings for a hybrid and reverse hybrid. Though many combinations are possible a couple types of deformation seem likely as most important. If the cross is softer than the main, the main will sink into the cross. To initiate movement along the cross, the main will first have to climb a hill out of the valley it sits in, but also it will have to continually plow its way forward as it moves and sinks down the length of the cross. If the cross is a multifilament or multistrand string, it can also fray and break filaments. These can stick up as obstacles, hooks, or spikes that can slow movement over them. If the main is softer than the cross, it will deform over the cross such that it forms a slot or groove to move over the cross. That may actually facilitate movement, especially if the deformation causes a leakage of some oil, lubricant, etc. from inside the string.
Table 2 shows the same strings sorted by the percent of the sliding COF to the static COF. This highlights those strings that behave radically different in sliding compared to static situations. Three things are immediately apparent:
- The PU-coated Tecnifibre and Wilson strings all slide much better than one might expect by looking at their static COFs, which are all at the bottom of the list when sorted by static friction. These strings are difficult to get moving, but once they are, they are all in the top half of the table when sorted by sliding COF (Table 1).
- Shaped or textured strings that are toward the top (slipperiest) of the static COF list fall toward the bottom of the sliding COF list.
- All other strings behave in a more generalizable manner, with the sliding COF being 40-60% of the static COF.
Sliding Coefficient of Friction
(Sorted by Ratio Sliding/Static COF)
| Brand | String | Material | Shaped | Sliding COF | Static COF | COR Ratio |
|---|---|---|---|---|---|---|
| Tecnifibre | TGV 16 | N | 0.057 | 0.239 | 23.8% | |
| Tecnifibre | X.Code 16 | P | 0.055 | 0.21 | 26.2% | |
| Tecnifibre | xr3 17 | N | 0.047 | 0.159 | 29.6% | |
| Tecnifibre | E-Matrix 17 | N | 0.056 | 0.184 | 30.4% | |
| Wilson | NXT Tour 17 | N | 0.058 | 0.18 | 32.2% | |
| Ashaway | Dynamite 17 | N | X | 0.091 | 0.278 | 32.7% |
| Volkl | Power Fiber II 17 | N | 0.054 | 0.15 | 36.0% | |
| Gosen | OG Sheep MIcro Super 16L | N | 0.056 | 0.145 | 38.6% | |
| Gamma | Zo Power 16L | P | 0.052 | 0.132 | 39.4% | |
| Isospeed | Professional Classic 17 | N | 0.087 | 0.207 | 42.0% | |
| Weiss Cannon | TurboTwist | P | X | 0.05 | 0.117 | 42.7% |
| Babolat | VS Team 17 | G | 0.063 | 0.147 | 42.9% | |
| Gamma | Zo Ice 16 | P | 0.044 | 0.102 | 43.1% | |
| SuperString | Viper V2 Rough 16L | P | X | 0.042 | 0.097 | 43.3% |
| Weiss Cannon | Silverstring 1.25 | P | 0.047 | 0.108 | 43.5% | |
| SuperString | Nikita Original 17 | P | 0.048 | 0.109 | 44.0% | |
| Babolat | Pro Hurricane Feel 16 | P | 0.04 | 0.089 | 44.9% | |
| Signum Pro | Tornado 17 | P | X | 0.065 | 0.139 | 46.8% |
| Prince | Synthetic Gut Original 17 | N | 0.058 | 0.124 | 46.8% | |
| Gamma | Live Wire 16 | N | 0.068 | 0.145 | 46.9% | |
| Tourna | Big Hitter Rough 17 | P | X | 0.063 | 0.13 | 48.5% |
| Prince | Tournament Poly 16 | P | 0.044 | 0.09 | 48.9% | |
| MSV | Focus-EVO 17 | P | 0.048 | 0.098 | 49.0% | |
| Ashaway | Dynamite Soft 17 | N | X | 0.101 | 0.204 | 49.5% |
| Tecnifibre | Pro Redcode 17 | P | 0.054 | 0.109 | 49.5% | |
| Signum Pro | Plasma Pure 1.23 | P | 0.053 | 0.106 | 50.0% | |
| Tecnifibre | Black Code 17 | P | 0.059 | 0.118 | 50.0% | |
| Gamma | Synthetic Gut 16 w/Wearguard | N | 0.066 | 0.13 | 50.8% | |
| Head | FXP Power 16 | N | 0.057 | 0.112 | 50.9% | |
| Mantis | Comfort Polyester 16 | P | 0.048 | 0.092 | 52.2% | |
| Tourna | Quasi-Gut 16 | N | 0.067 | 0.128 | 52.3% | |
| Luxilon | Big Banger Timo 17L | P | 0.051 | 0.094 | 54.3% | |
| SuperString | Nikita Soft 17 | P | 0.047 | 0.085 | 55.3% | |
| Topspin | Cyber-Blue 1.25 X | P | 0.05 | 0.09 | 55.6% | |
| Signum Pro | Poly Plasma 16L | P | 0.055 | 0.098 | 56.1% | |
| Polyfibre | TCS 1.25 | P | 0.056 | 0.098 | 57.1% | |
| TopSpin | Cyber Flash 17 | P | 0.061 | 0.103 | 59.2% | |
| Kirschbaum | Spiky Shark 17 | P | X | 0.071 | 0.118 | 60.2% |
| Luxilon | Big Banger Alu Power Rough 16L | P | X | 0.081 | 0.127 | 63.8% |
| MSV | Hepta-Twist 16 | P | X | 0.058 | 0.085 | 68.2% |
| MSV | Focus Hex 1.18 | P | X | 0.066 | 0.071 | 93.0% |
| Hybrid | Babolat VS Touch 16 M / Wilson NXT Tour 17 X | G-N | 0.049 | |||
| hybrid | Baboat VS Touch M / Topspin Cyber-Blue 1.25 X | G-P | 0.052 | |||
| Hybrid | Babolat VS Touch 16 M / Tecnifibre TGV 16 X | G-N | 0.054 | |||
| Wilson | Enduro Tour 16 | P | 0.054 | |||
| Hybrid | Babolat VS Touch 16 M / Prince Synthetic Gut Original 17 X | G-N | 0.056 | |||
| Hybrid | Babolat VS Touch 16 M / Weiss Cannon Silverstring 1.25 | G-P | 0.057 | |||
| Hybrid | Gamma Zo Ice 17 M / Babolat VS Team 17 X | P-G | 0.057 | |||
| Hybrid | Prince Tournament Poly 16 M / Babolat VS Team 17 X | P-G | 0.057 | |||
| Hybrid | SuperString Viper V2 Rough 16L M / Babolat VS Team 17 X | P-G | 0.059 | |||
| Hybrid | Klip Legend (uncoated) Gut 16 M / Tecnifibre Black Code 17 X | G-P | 0.062 | |||
| Wilson | NXT Max 16 | N | 0.062 | |||
| Hybrid | Babolat VS Touch 16 M / Gamma Live Wire 16 X | G-N | 0.063 | |||
| Hybrid | Head FXP Power 16 M / Babolat VS Team 17 X | N-G | 0.064 | |||
| Hybrid | Signum Pro Poly Plasma Pure 17 M / Babolat VS Team 17 X | P-G | 0.064 | |||
| Hybrid | Babolat VS Touch 16 M / MSV Focus Hex 1.18 | G-P | 0.066 | |||
| Hybrid | Gamma Live Wire 16 M / Topspin Cyber-Blue 1.25 X | N-P | 0.066 | |||
| Klip | Legend uncoated Gut 16 | G | 0.069 | |||
| Hybrid | Wilson NXT Tour 17 M / Topspin Cyber-Blue 1.25 X | N-P | 0.076 | |||
| Hybrid | Baboat VS Touch M / Asnaway Dynamite 17 X | G-N | 0.099 |
5. CONCLUSION
In general, at least for the strings measured to date, a string's sliding friction compared to other strings is in approximately the same relative position as its static friction. But not in all cases. The mechanics of initiating or maintaining string movement are different depending on the hardness, shape, and construction of the string or hybrid. Each of these variables can have a larger or smaller effect depending on whether movement is being inititated or maintained. Also, timing is crucial. How long it takes to get the string moving, how far it moves, and when, how far and with how much ball contact it snaps back are all important to the final spin effect. String movement by itself does not necessarily equate with spin, but it is as good a predictor that we have. Future experiments will measure the spin of various strings and combinations to more accurately determine the correlation between static and sliding friction and spin. At this time, we can say that strings with lower static and/or sliding coefficients of friction are more likely to create more spin. But we can't say how much more. In other words, how much difference does a difference in friction make? Players can subjectivly give us an answer, but a more accurate quantification is still to come.