ABSTRACT
Do Strings Lose Power and Control With Use?
Tests were performed to measure changes in string properties and performances due to repeated use. Among parameters measured were string tension, stiffness, peak force, energy return, dwell time, deflection, vibration frequency, and coefficients of friction between strings. Measurements were performed using test apparatus to simulate impacts as well as strung racquets where spin, speed, and angle of rebound were measured. The results indicated that so-called string death is primarily due to the consequences of a decrease in perpendicular stiffness as well as the increasing of static and sliding friction between main and cross strings. Together, these account for most of the player's perceptions and complaints about strings "going dead."
(Note: Part 2 of this paper is here: How Strings Go Dead — Part 2
INTRODUCTION
Player's Perception of Strings Going Dead
Tennis players often complain that a tennis string, especially polyester string, "goes dead." It is generally described as occurring after 2-20 hours of play. This phenomenon has various and often contradictory descriptions. Some of the descriptions are these:
- "The strings lose power."
- "The strings hurt my arm."
- "The strings feel stiffer."
- "It hits like a board."
- "The strings lose their resiliency."
- "The strings lose their elasticity."
- "My strings are staying out of place."
- "There is no pop."
- "I can't hit the ball deep."
- "I can't control the ball."
- "I spray the ball all over the place."
- "I can't keep the ball in the court."
- "The ball just takes off."
- "The the strings are mushy."
- "The strings trampoline the ball."
- "My ball isn't as heavy."
- "I can't hit with as much spin."
These are strange and contradictory descriptions of the strings going dead. Some players experience too much stringbed action and others feel complete loss of stringbed action. And these contrary opinions can be about the very same string. The players can agree on how a string feels when it is freshly strung, but disagree about how it feels after a match or two. Presumably, the string properties change in the same way over repeated impacts for all players of similar playing style, whether or not they are experienced the same way.
It is often tempting to dismiss many such descriptions as imaginary, as they sometimes fly in the face of scientific research. But tennis players are a finely tuned bunch, and when they say something has changed in stringbed or racquet performance, they are usually correct, even if their descriptions of what is occurring ends up to be off target or incorrect. After all, how can two completely opposite descriptions of a string going dead be correct? Well, as this research will show, it seems that they can.
At impact, the only information the player has is the shock and vibration at the handle. This is what the player feels. He then interprets and describes the sensation of that feeling. Added information also contributes to the interpretation — the sound, where did the ball land, what did the trajectory look like, and did I win the point, game, match? These considerations indicate two directions in which to look for an answer — what changes in a string to alter (a) the impact signal to the player and (b) the on-court performance of the string. In other words, what occurs to a string to change the forces felt and/or the speed, spin, and angle of the rebound from the racquet?
We begin by asking what makes a poly a poly in terms of performance? Most players agree that its distinctive feature is that it is dead — it is stiff, deforms the ball more, and loses more energy as a result. The player can therefore swing out on every ball without hitting it over the fence, and he feels that he has more control. So, becoming even more dead in a power output sense probably is not what the player is feeling when he says that the strings no longer perform. Instead, it is the opposite — the strings are losing their deadness and becoming more powerful, or at least the ball is traveling farther and wider, and the player feels he has lost control and the string has taken over.
The other distinctive feature of poly is its spin potential. Polyester's extra spin is derived from the sideways movement and snap-back of the main strings. A lessening in the efficiency of this sliding and snap-back would diminish spin and certainly qualify as "going dead." The stringbed performs in two planes, perpendicular and parallel to the racquet head. Most players are more familiar with the perpendicular performance and describe their stringbed perceptions in terms of that conceptual vocabulary. But with the advent of widespread polyester use, the stringbed events have become more obviously 3-dimensional and our descriptions and research will evolve to reflect that fact.
A side effect of lateral main string movement is that it softens the feel of the stringbed. If the mains begin to move less easily or not at all, the impact shock will feel larger. Again, a good candidate for string death.
Given these hypotheses, we set out to find what happens to a string such that the phenomenon of "going dead" can include such seemingly contradictory statements that the string has too much power, is stiffer and hurts the player's arm.
THE EXPERIMENTS
The following tests were performed on nylon and polyester strings:
- Repeated impacts with a pendulum hammer on a single string to measure changes in tension, stiffness, peak force, impact deflection and duration.
- Repeated impacts on a strung racquet by dropping a 20 pound kettlebell from a height of about 10 inches and then measuring speed, spin and angle of high-speed ball rebound.
- Impacts on a strung racquet with a "pile-driver" hammer to measure peak stringbed force and impact duration after repeated impacts.
- Measurements of racquet vibration frequency after impacts.
- Coefficient of static friction between strings after repeated sliding against each other under pressure.
- Coefficient of sliding friction between strings after repeated sliding against each other under pressure.
RESULTS
1A. Pendulum Hammer Tests
Several nylon and polyester strings were chosen to get a range of values for each string property. More polyester strings were tested because it is much more common to hear that polyester strings go dead compared to any other material. Consequently, the nylon strings were used as a baseline. The strings are shown in Table 1:
| Table 1 Strings Tested with Pendulum Hammer | ||||
|---|---|---|---|---|
| Brand | String | Material | Reference Tension (lb) | Number of Hits |
| Babolat | RPM Team 16 | Polyester | 62 | 800 |
| Dunlop | Black Widow 16 | Polyester | 62 | 800 |
| Gamma | TNT Touch 16 | Nylon | 62 | 800 |
| Gamma | TNT2 16 | Nylon | 62 | 4000 |
| Kirschbaum | Pro Line X 16 | Polyester | 62 | 800 |
| L-Tec | Premium 3S 17 (1.25) | Polyester | 62 | 800 |
| Luxilon | 4G 16L | Polyester | 62 | 7000 |
| Luxilon | Big Banger 16 | Polyester | 62 | 4000 |
| MSV | Focus Hex 17L (1.18) | Polyester | 62 | 5500 |
| Polyfibre | TCS 1.30 | Polyester | 62 | 2000 |
| Prince | Syn Gut Original 16 | Nylon | 62 | 4000 |
| Prince | Tour 16 | Polyester | 62 | 3000 |
| Solinco | Tour Bite 16 | Polyester | 62 | 9000 |
| Tecnifibre | NRG2 16 | Nylon | 62 | 2000 |
| Tourna | Big Hitter Black 7 17 | Polyester | 62 | 3000 |
| Wilson | NXT 16 | Nylon | 62 | 3500 |
Table 1 — Strings tested with pendulum hammer.
Strings were tensioned to 62 pounds. As shown in Figure 1, a pendulum hammer, weighted to create a peak force equivalent to that during a 120-140 mph serve on a single string, was raised and released in multiples of 100, 500, or 1000 repetitions. After each set, a further impact was performed to measure the tension, peak force, longitudinal and perpendicular stiffness, impact duration and string deflection. Not all strings were tested the same number of times. Some were only impacted 800 times and others up to 9,000.
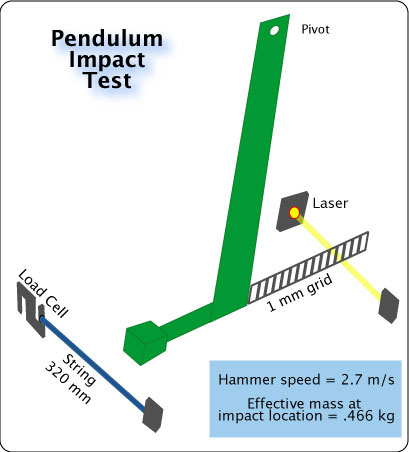
Figure 1 — Setup of Pendulum Test. The load cell and photocell are plugged into an oscilloscope where the changes in tension, string deflection, and time are displayed. Longitudinal and transverse stiffness, peak force, and energy return are calculated using that information.
TENSION LOSS. The most commonly discussed phenomenon of string performance is that all strings lose tension from the second they are put into the racquet — up to 15 pounds in one minute. Polyester loses more than nylon which loses more than gut. Strings stabilize quickly after the few first minutes. But they lose a lot of tension on the very first few hits, as much as 20 pounds in 20 hits on the test machine. But again, they stabilize somewhat. But still, even after losing 20-35 lbs before you have played a game, stiffer polyester strings can produce a stiffer stringbed than softer nylon strings that lose only a few pounds. None of this preliminary tension loss matters that much. The important thing is how the string feels when you begin play and, if you like that feel, how long the string maintains that feel.
What is important is how the strings change once you get them broken in. We were interested in what happens to the string after 100 test impacts. At this point, most strings have reached their stabilized performance degradation rate. Figure 2 shows how tension decreases as hit number increases.
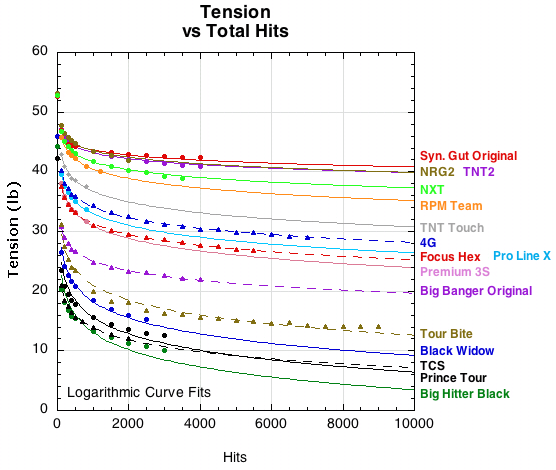
Figure 2 — Absolute change in tension after first 100 hits. Reference tension for all strings was 62 pounds. Each string was at a different tension after the 100 hit break-in period.
Figure 2 clearly shows the disparate starting tensions after being tensioned to 62 pounds and then hit 100 times. The range of tension difference at 100 hits is about 30 pounds and and at the extrapolated 10,000 hits it is about 40 pounds. This is an extraordinary difference in strings that all started their lives at the same tension. But does it matter?
Perhaps it is not the absolute change in tension that is important but rather the rate of change? The differential rates of tension loss are not completely apparent from Figure 2 — the curves all look almost parallel to each other. Figure 3 corrects this, showing each string's percent change in tension relative to its own tension at 100 hits. Every string starts out at 100%, even though the absolute value at which they start may be radically different due to all the preliminary tension loss described above in Figure 2.
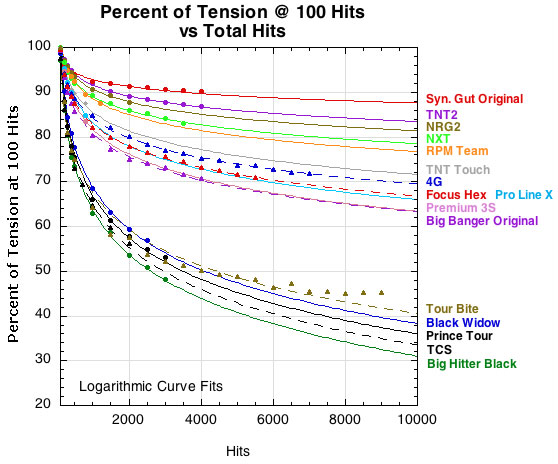
Figure 3 — Percentage change in tension after stringing and break-in.
Whereas Figure 2 highlights the absolute tensions but not the degree of change in tension, Figure 3 highlights the degree of change relative to the starting tension at 100 hits. The strings are in the same order in both graphs, but Figure 3 indicates more separation between strings in their relative tension loss — perhaps 2-3 separate clusters.
But a string starting at 50 pounds and losing 5 pounds loses 10% of that tension and a string starting at 10 pounds losing the same 5 pounds loses 50%. Can the same 5 pounds feel radically different to a player depending on the initial tension? The answer is that what you feel as the firmness of the stringbed depends on the string property known as stiffness as well an on tension. So the feel related to losing 5 pounds will depend on the stiffness of string losing the 5 pounds.
STIFFNESS. We are concerned with two kinds of dynamic (impact) stiffness — longitudinal (k) and perpendicular (kp). We measure longitudinal stiffness as the amount of force required to stretch a string of a given length 1 inch (lb/in):
F = kx
where F is the longitudinal force along the string, x the elongation, and k is longitudinal stiffness. For a string, the force is the rise in tension. Solving for longitudinal stiffness, we get:
k = F/x
For every string, the more you stretch it, the more force is required for each additional unit of stretch, and the string is said to get stiffer. But some strings require more force for each additional unit of stretch than do others. In other words, the more an impact stretches any given string, the higher the tension will be during the impact, and it will be higher for stiffer strings.
Perpendicular stiffness is measured as the force necessary to push a tensioned string sideways 1 inch:
Fp = kpy
where Fp is the perpendicular force, y the deflection, and kp the perpendicular stiffness. Solving for perpendicular stiffness we get
kp = Fp/y
These stiffness formulas look very similar but, as we will see, they yield very different numbers. (NOTE: See Appendix A for more discussion on longitudinal and perpendicular stiffness.)
The question, then, is whether a change in either kind of stiffness leads to string death. Figure 4 shows the change in longitudinal stiffness as tension declines (i.e., as hits increase).
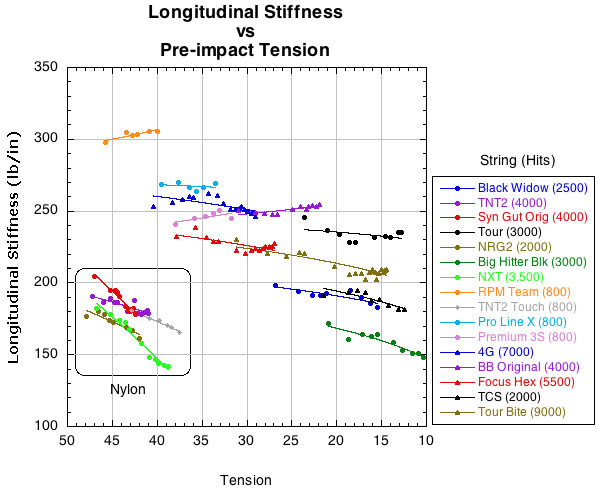
Figure 4 — Change in longitudinal stiffness as tension decreases (i.e., as hits increases).
It is apparent in Figure 4 that of all the strings measured that the polyester strings are as stiff or stiffer longitudinally at any tension compared to the nylon strings. This is important because nylon strings typically are not described as going dead, so they serve as a sort of baseline. Remember, all these tensions are the result of originally pulling tension to 62 pounds and then hitting 100 times.
Figure 5 shows the change in perpendicular stiffness as tension declines.
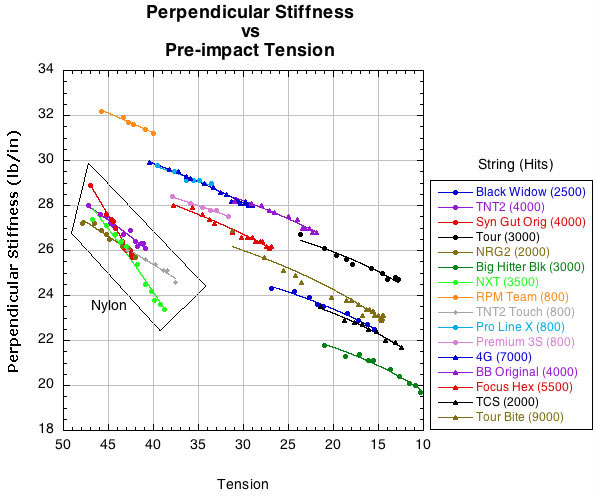
Figure 5 — Change in perpendicular stiffness as tension decreases (i.e., as hits increases).
Figure 5 shows a completely different picture compared to Figure 4. The polyester strings (everything not in the "nylon" box) have the same or lower perpendicular stiffness as do the nylon strings. It takes less force to push those strings sideways a designated distance than it does the nylons. This is very interesting. These strings are easier to deflect than the nylons, and as tension goes down, they get even easier. And this is true even though they are inherently stiffer longitudinally at all tensions. The are more difficult to stretch but less difficult to deflect than the nylons.
DEFLECTION AND DWELL TIME. Does this show up in our deflection measurements? Does deflection increase for each string as tension decreases? Figure 6 demonstrates that this is so.
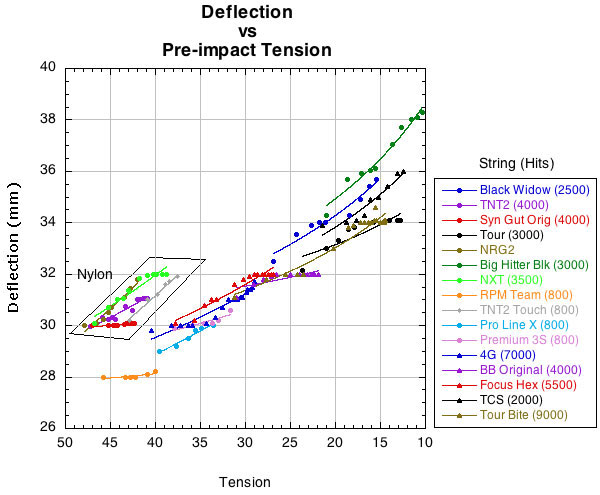
Figure 6 — Change in deflection as tension decreases (i.e., as hits increases).
Figure 7 shows the same thing for dwell time vs tension.
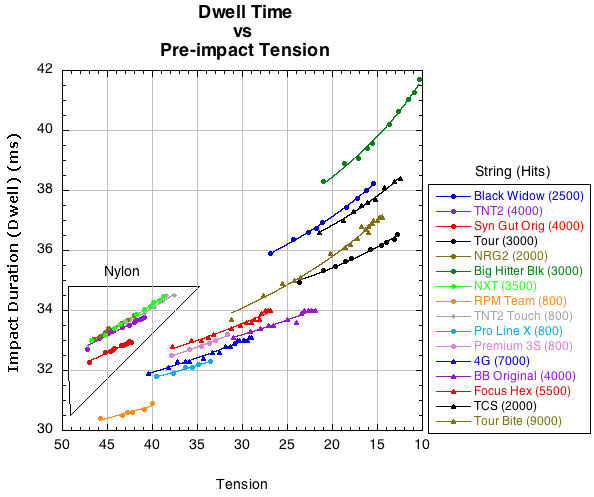
Figure 7 — Change in dwell time as tension decreases (i.e., as hits increases).
Figure 6 shows that even though virtually all polyester strings are at a lower tension than the nylons, half deflect about the same as the nylons and half deflect more. Figure 7 shows a similar phenomenon for dwell time: half the polyesters have about the same dwell and half a greater dwell than the nylons. What does this mean? A longer dwell time means the ball will be on the strings for a larger distance of the stroke arc, thereby taking off at a higher and/or wider trajectory. And a larger stringbed deflection could further alter the angle of the rebound, depending where on the stringbed you make contact. Together, larger deflection and longer dwell time could cause the ball to fly longer and wider, depending on the horizontal and vertical arc of the stroke during impact. Then your control may go dead.
Figure 8 shows a very dramatic connection between perpendicular stiffness and dwell time. As perpendicular stiffness declines, dwell time starts increasing at ever faster rates. Perhaps a player can feel this added dwell time or notices the longer, wider, higher trajectories associated with it.
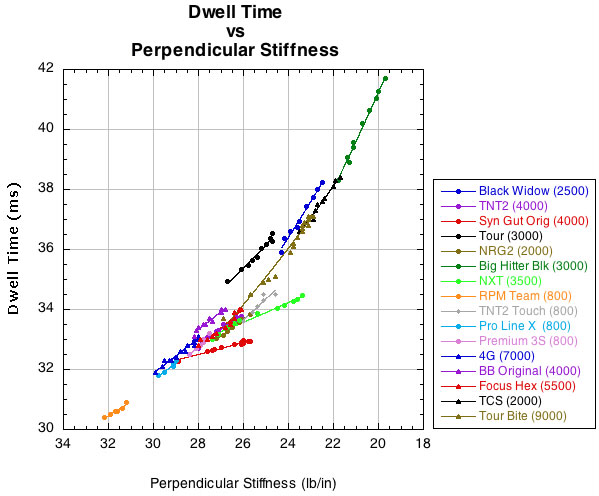
Figure 8 — Change in dwell time as perpendicular stiffness decreases.
We seem to have some evidence then that a change in string properties can result in flying balls, losing control, and too much power, just as many players have complained. One facet of strings going dead is that control goes dead due to longer dwell time and the consequent change in launch angle. The magic of polyester of taking power out of the impacts and returning it to the player's stroke has gone dead. Its deadness is dead.
(NOTE: See Appendix B to see "fingerprint" graphs of all parameters of each string.)
If low tension and perpendicular stiffness are the necessary conditions for the "going dead" syndrome, does that mean that strings that stay above some absolute threshold of tension and stiffness do not or cannot go dead? That can't be because many higher tension strings are said to go dead also. We have only identified one kind of going dead. There must be more in order to explain the range of strings that get labelled as such and for the reasons they do. Next we will analyze the rebounds off a fully strung racquet to see if we can find changes in string parameters that lead to changes in performance (i.e., speed, spin, and angle of return).
1B. Racquet and Kettlebell Test
A Wilson Pro Staff Six.One 100 was strung with Dunlop Black Widow 16, Polyfibre TCS 16, and Solinco Tour Bite 16 at 52 pounds. A Wilson Steam was strung at 52 pounds and tested with Solinco Tour Bite 16. Each setup was subjected to impacts with a 20-pound kettlebell dropped from about 10 inches. After each group of impacts, a scissors was used to move strings back and forth to simulate sideways string movement wear that did not occur with the perpendicular kettlebell drops. Scissors were placed in five adjacent string squares and opened 50 times, thereby moving each string 100 times in the hitting area. The combination of the kettlebell drops and the scissors movement was designed to be in excess of normal impacts by a ball, thus accelerating any potential changes in properties. However, the string movement was not performed under a perpendicular load, as it would be in an impact and therefore may not have had the desired effect. Movie Screens 1 and 2 show the techniques for impacting the racquets and moving the strings.
Movie 1
Racquet Impact Technique
Movie Screen 1 — Kettlebell drop.
Movie 2
String Movement Technique
Movie Screen 2 — Technique to simulate string movement and wear.
After each series of kettlebell drops and scissors movement, balls were fired at the free-hanging racquet to measure rebound speed, spin, and angle. The goal was to observe any change in performance characteristics due to repeated impacts. Because the speed, spin, and angle of balls fired from a ball machine vary slightly from shot to shot, these input parameters were normalized (procedure described in the article "Spin and Material") to be the same for a given racquet. Each racquet was normalized separately since what interests us are the performance changes for a given racquet, not between racquets. About 15 balls were fired and measured after each series of kettlebell drops. Table 2 shows the average results.


| Racquet | Brand | String | Number Hits | Velocity In (mph) | Spin In (rpm) | Angle In (deg) | ACOR | Spin Out (rpm) | Angle Out (deg) |
|---|---|---|---|---|---|---|---|---|---|
| Wilson Pro Staff 100 | Dunlop | Black Widow 16 | 1 | 50.3 | 334 | 26.1 | 0.403 | 1455 | 34.1 |
| Wilson Pro Staff Six.One 100 | Dunlop | Black Widow 16 | 800 | 50.3 | 334 | 26.1 | 0.375 | 1505 | 36.3 |
| Wilson Pro Staff Six.One 100 | Dunlop | Black Widow 16 | 2000 | 50.3 | 334 | 26.1 | 0.374 | 1535 | 37.3 |
| Wilson Pro Staff Six.One 100 | Polyfibre | TCS 16 | 1 | 52.4 | 445 | 25.9 | 0.373 | 1632 | 37.5 |
| Wilson Pro Staff Six.One 100 | Polyfibre | TCS 16 | 500 | 52.4 | 445 | 25.9 | 0.384 | 1618 | 36.2 |
| Wilson Pro Staff Six.One 100 | Polyfibre | TCS 16 | 1500 | 52.4 | 445 | 25.9 | 0.393 | 1603 | 36.0 |
| Wilson Pro Staff Six.One 100 | Polyfibre | TCS 16 | 2500 | 52.4 | 445 | 25.9 | 0.393 | 1618 | 35.4 |
| Wilson Pro Staff Six.One 100 | Solinco | Tour Bite 16 | 1 | 52.8 | 351 | 28.3 | 0.417 | 1757 | 37.7 |
| Wilson Pro Staff Six.One 100 | Solinco | Tour Bite 16 | 300 | 52.8 | 351 | 28.3 | 0.423 | 1666 | 36.6 |
| Wilson Pro Staff Six.One 100 | Solinco | Tour Bite 16 | 1300 | 52.8 | 351 | 28.3 | 0.424 | 1693 | 36.8 |
| Wilson Pro Staff Six.One 100 | Solinco | Tour Bite 16 | 1800 | 52.8 | 351 | 28.3 | 0.419 | 1730 | 37.2 |
| Wilson Pro Staff Six.One 100 | Solinco | Tour Bite 16 | 3000 | 52.8 | 351 | 28.3 | 0.425 | 1697 | 37.3 |
| Wilson Pro Staff Six.One 100 | Solinco | Tour Bite 16 | 4000 | 52.8 | 351 | 28.3 | 0.411 | 1700 | 37.2 |
| Wilson Pro Staff Six.One 100 | Solinco | Tour Bite 16 | 5800 | 52.8 | 351 | 28.3 | 0.405 | 1719 | 37.1 |
| Wilson Pro Staff Six.One 100 | Tourna | Big Hitter Black 7 17 | 1 | 53.2 | 269 | 26.2 | 0.376 | 1394 | 35.2 |
| Wilson Pro Staff Six.One 100 | Tourna | Big Hitter Black 7 17 | 2300 | 53.2 | 269 | 26.2 | 0.357 | 1452 | 36.5 |
| Wilson Steam 105S | Solinco | Tour Bite 16 | 200 | 50.8 | 361 | 25.4 | 0.389 | 1554 | 33.8 |
| Wilson Steam 105S | Solinco | Tour Bite 16 | 1000 | 50.8 | 361 | 25.4 | 0.393 | 1559 | 33.5 |
Table 2 — Strings tested with kettlebell impacts.
Table 2 shows that there was very little change in performance of any category due to repeated abuse. On first glance, this would seem to say that there are not performance consequences to changes in string properties due to repeated use. We hypothesized above that, if nothing else, the increased dwell time due to tension loss would create a higher and wider launch angle as the ball remains on the racquet for a longer arc of the swing. This hypothesis is not disproved by the data in Table 2. Increased dwell time does not affect the rebound angle off a free-standing racquet. The racquet does not rotate enough during impact, especially during the peak force stage, to send the ball off at a different angle. But during a swinging impact, the racquet face can move through a large enough angle during impact to alter the trajectory of the ball. Also, we could not mesure the dwell time with our high-speed rebound test. To do that we performed the next test — the "pile-driver" test.
1C. Racquet Pile Driver Test
To test whether the dwell time of the racquet had actually increased and to see if peak force changes, we did a "pile-driver" test. The racquet was placed horizontally on the table with supports under the tip and throat. The stringbed was situated under a steel rod loaded with about 8 pounds, including the rod, and instrumented with a force gauge connected to an oscilloscope. The shaft hammer was aimed to hit 11.5 cm from the inside tip of the racquet, close to where the kettlebell and ball impacts were occurring. The rod was raised about 14 cm above the racquet and dropped, delivering about 5 Joules of energy at impact. The peak force and dwell time of the pile-driver head were measured. This test was only done with one string — Polyfibre TCS 16. Measurements were taken after each series of kettlebell drops described above. The results are presented in Table 3.
| Table 3 Peak Force and Dwell Time of Pile-Driver Following Kettlebell Drops | |||||
|---|---|---|---|---|---|
| Racquet | Brand | String | Number Hits |
Peak Force (lb) |
Dwell Time (mph) |
| Wilson Pro Staff Six.One 100 | Polyfibre | TCS 16 | 1 | 141 | 33.5 |
| Wilson Pro Staff Six.One 100 | Polyfibre | TCS 16 | 500 | 135.5 | 35.72 |
| Wilson Pro Staff 100 | Polyfibre | TCS 16 | 1000 | 136.5 | 35.75 |
| Wilson Pro Staff Six.One 100 | Polyfibre | TCS 16 | 2000 | 136.5 | 38.85 |
| Wilson Pro Staff Six.One 100 | Polyfibre | TCS 16 | 3000 | 136.5 | 37.91 |
| Wilson Pro Staff Six.One 100 | Polyfibre | TCS 16 | 4000 | 138.1 | 36.73 |
Table 3 — Peak force and dwell time of pile-driver hammer impacted the racquet stringbed after the specified number of kettlebell impacts.
The results in Table 3 are a bit confusing. For the first 2000 kettlebell hits, the peak force decreased and the dwell time increased. That is as you would expect as tension declines with impacts and it agrees with our single string tests above. By 4000 hits, however, the peak force went up and dwell time declined. More hits would be necessary and more strings tested to see if this was a change in trend or an outlier.
1D. Racquet Vibration Frequency Test
As a last test on the fully strung racquet, we measured the vibration frequency of the Polyfibre TCS setup after each series of kettlebell impacts. This test was performed to see if there were vibration changes that a player could feel as tension declined and interpret as string death. As Table 4 shows, there was no change in vibration frequency due to changes in string properties. At least for this one racquet setup, that would argue against the change in vibration as a felt cue by the player of property change.
| Table 4 Racquet Vibration Frequency Following Kettlebell Drops | ||||
|---|---|---|---|---|
| Racquet | Brand | String | Number Hits |
Vibration Frequency (Hz) |
| Wilson Pro Staff 100 | Polyfibre | TCS 16 | 1 | 152 |
| Wilson Pro Staff 100 | Polyfibre | TCS 16 | 500 | 151 |
| Wilson Pro Staff 100 | Polyfibre | TCS 16 | 2000 | 152 |
| Wilson Pro Staff 100 | Polyfibre | TCS 16 | 3000 | 154 |
| Wilson Pro Staff 100 | Polyfibre | TCS 16 | 4000 | 152 |
1E. Coefficient of Friction Tests
One of the hallmarks of polyester strings is the sideways movement and snap-back of the main strings. The snap-back is the main contributor to the extra spin and higher launch angle generated by polyester. The sideways movement will also soften the impact force parallel to the stringbed. The primary factor in determining the amount of movement is the inter-string friction between the mains and crosses. If that friction is low, the strings will move, and if it is too high, they will not move. For a given impact force, the measure of how much friction there will be depends on the coefficient of friction (COF). This is a measure of all the factors that cause strings to stick together, preventing movement — atomic attraction, atomic level fit of adjacent topographies, and relative deformation. Inter-string friction comes in two forms — static and sliding friction. Static friction resists the initiation of movement between strings, and sliding friction resists and retards movement once it has been initiated. Each has its own coefficient: the static and sliding coefficient. The static coefficient is generally larger than the sliding coefficient. The formula for friction is
F = μN
where F is the friction force, μ the coefficient of either static or sliding friction, and N is the normal force perpendicular to the surface pushing the two surfaces together.
An increase in either or both coefficients would decrease the amount and speed of the the sideways main string movement. This in turn would increase the felt force of impact, stiffen the string plane parallel to the stringbed, decrease spin, and lower the impact angle. In short, the racquet would feel harsher, stiffer, lower powered, and lacking in spin production — i.e., the other side of the spectrum of perceptions reported by players.
To determine whether or not the COFs were changing with repeated use, we measured both using the TWU apparatuses designed for the purpose (these are described in the articles "Static Friction and Spin" and "Sliding Friction and Spin"). The results are presented below in Figures 9-12. These graphs are more chaotic than those above presenting the other string parameters. One reason for that is that the friction devices were designed to measure "out of the package" friction, which does not involve fitting strings in notched grooves as they slide on inclines. As a result, there is more scatter about the curve fits as strings sometimes "jumped the tracks." The other part of the chaos is that each string does appear to respond differently to wear compared to others. It is this differential amounts and rate of change that points not only to the degree of string death, but also to some strings dying sooner or later than others. This is exactly what players report.
Figure 9 plots the actual static COF vs repetitions and Figure 10 graphs the COF as a percent of the first repetition value. Figures 11 and 12 do the same for the sliding COF. The only difference in presentation is that the curve fits for the static COFs are polynomial fits and they are logarithmic for the sliding COFs. These were chosen simply because they best presented the data in order to see the trends. Also, the number of repetitions for the sliding COF tests were usually fewer due to the logistics of the testing procedure.
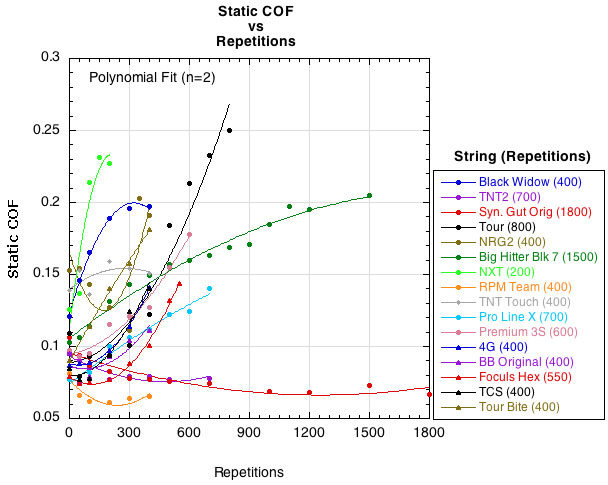
Figure 9 — Static COF vs repetitions.
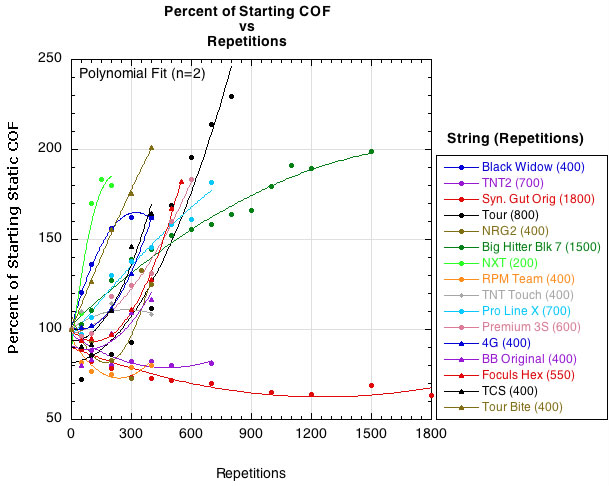
Figure 10 — Percent of starting static COF vs repetitions.
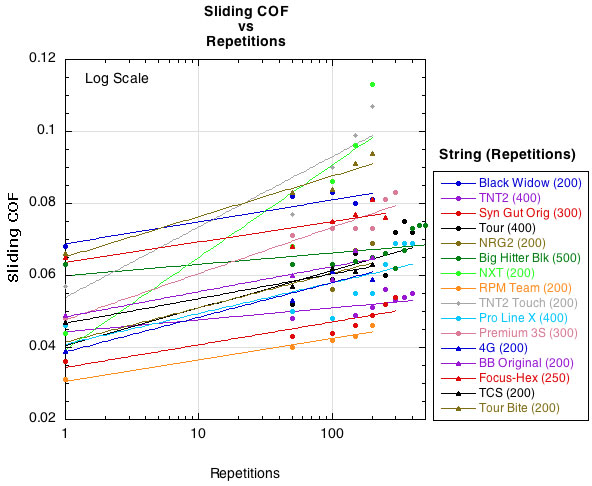
Figure 11 — Sliding COF vs repetitions.
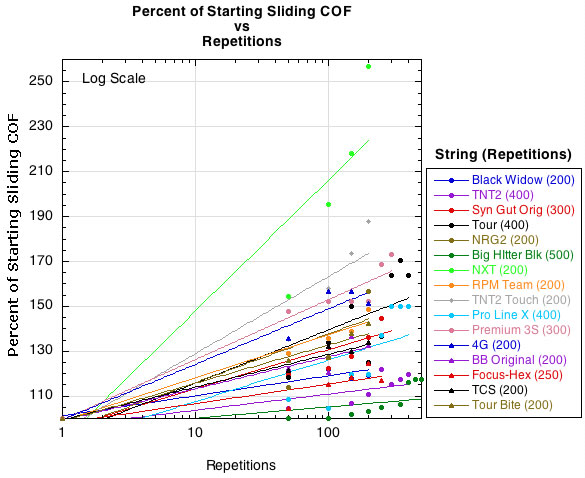
Figure 12 — Percent of starting sliding COF vs repetitions.
The data shows that both the static and sliding COFs tend to increase, though for a few strings the static COF initially decreases before increasing. The data also shows that the COF of some strings increases faster than others. The question, however, is at what value of either COF do you begin to notice a change in the performance? Whatever that level is, it must be assumed that the nylon COFs are generally greater than that threshold value beginning at installation. If so, then any increase in COF is not noticed as much with nylon because the strings move so little to begin with. The polyesters, on the other hand, have a low out-of-the-package COF allowing mains and crosses to slide against each other. Thus, a change in COF that limited this movement would be noticed for polyester.
That being said, the data reveals an anomaly that presents an interesting conundrum. A couple of nylon strings are among the lowest static and sliding COFs (these strings were tested with two different sets of string to confirm the data). This is contrary to our understanding that nylon strings do not move and snap back as efficiently as polyester strings. Two hypotheses present themselves as to why this can be so. First, nylon maintains tension better than polyester, so strings in a strung racquet will have a higher constant force pushing the string intersections together, increasing adhesion and notching and limiting movement as a result. Second, the friction rigs used to test the strings only promote notching in the simulated main string and not the cross. The cross, instead, becomes flattened for the entire distance the main slides across it. Testing so many strings did not allow time for string intersections to remain stationary under pressure for any length of time and to thus notch both the main and cross. Since softer nylons tend to notch more easily than polyester, this would tend to affect the COF measurement of nylons more than polyesters. Notching tests thus remain to be performed.
NOTE: See Appendix C for combined graphs of the static and sliding COF for each string.
CONCLUSION
The data provides evidence to support the speculations of many players on the causes and perceptions of polyester strings going dead. The lower tensions and perpendicular stiffness of many polyesters leads to longer dwell times and greater deflection. This keeps the ball on the racquet for a longer arc of the stroke, potentially creating "power" problems with the ball going deeper, wider and higher than desired. The decrease in perpendicular stiffness also contributes to the sensation that the strings get "mushy" or behave like a trampoline. A loss of control is the end result. Further, the stroke itself may thus be affected to compensate for the changes in the string.
On the other side of the coin, increasing static and/or sliding coefficients of friction will decrease the amount and efficiency of the sideways main string movement and snap back. This, in turn, decreases spin, lowers launch angle, and stiffens the stringbed parallel to the strings. This is perceived as a loss of power and spin as well as an increase in stiffness, harshness, and pain, especially if the player starts swinging even faster to compensate.
If only it were so easy. It seems whenever there is one causal factor acting to increase a performance variable, there is another that arises to decrease that variable. In this case, as tension and perpendicular stiffness decrease with repetitions, increasing the "power" behavior of the strings, so to do the repetitions increase the friction coefficients, making the strings feel stiffer and low-powered. And, then, in another turn, the decrease in tension should also decrease the friction between strings. So the strings are simultaneously gaining and losing in power behaviors or in stiffness and softness characteristics. It is the net effect that determines the player's perception of string performance.
APPENDIX
APPENDIX A — STIFFNESS CONTINUED: Longitudinal stiffness is considered a primary property of the string whereas perpendicular stiffness is a derived property, itself being dependent on longitudinal stiffness because the string must stretch to be moved sideways. As it stretches, the tension increases until a peak tension is achieved. As shown in Figure 13, this peak tension is directed along the string but has two components, one tension component parallel to the stringbed (T2 parallel) and one tension component perpendicular to it (T2 perp). It is the perpendicular component of the peak tension that pushes back against the ball. So the higher the peak tension, the more the string resists further deflection, and the higher will be the perpendicular stiffness. Perpendicular stiffness is always much less than longitudinal stiffness — 20-35 lb/in and 130-300 lb/in, respectively. Though longitudinal stiffness is the primary property, perpendicular stiffness is what the player and the ball feel on impact.
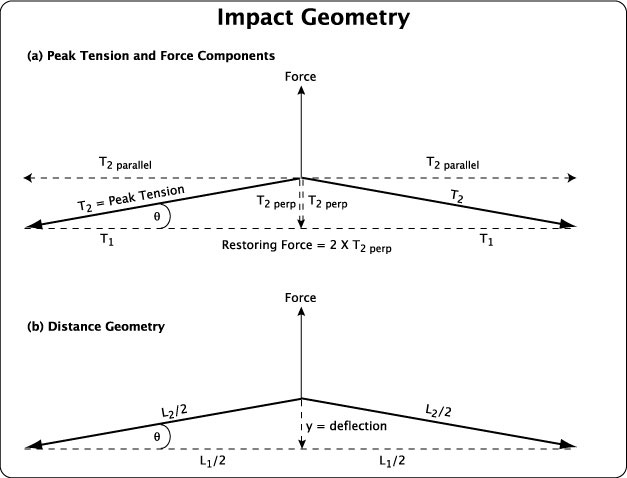
Figure 13 — Impact diagram labelled by (a) forces and (b) distances. The rise in tension from T1 to T2 (diagram a) due to stretching the string from L1 to L2 (diagram b) is directed along the string but has two components, one parallel and one perpendicular to the un-stretched string. It is the perpendicular restoring force (each half of the string pushes back in the perpendicular direction so the force is represented by two perpendicular dotted lines) that is responsible for perpendicular stiffness and impact shock and ball deformation.
It's not intuitively obvious why perpendicular stiffness is less than longitudinal stiffness and that the stringbed can deflect so much more than it stretches (i.e., why the denominators of the stiffness formulas [x an y] are so different from each other). Figure 14 makes this clear. For deflection angles less than 45 degrees, the geometry dictates that deflection is greater than elongation. That is why you can manually push a string sideways 1 inch fairly easily, but you could not stretch it an inch by pulling on its ends.
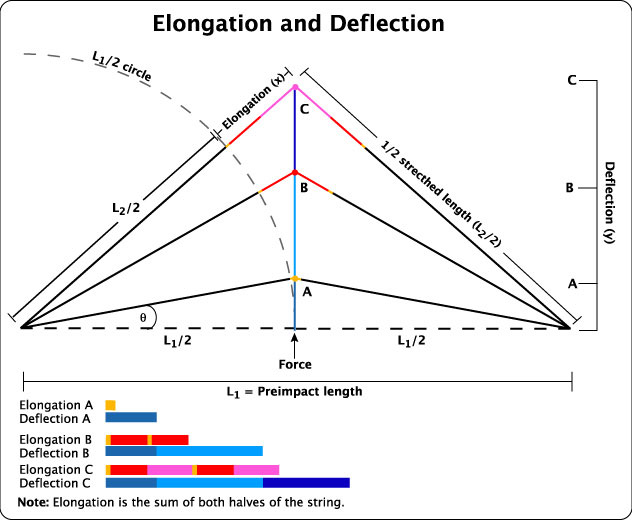
Figure 14 — Change in elongation vs deflection upon impact. The dotted circle represents half the original length of the string and is the baseline against which impact elongation is shown. Each deflection distance (A, B, C) is associated with an elongation distance (the colored diagonal lines). At small deflections, the deflection compared to the elongation is large. At greater deflections, elongation begins to catch up with greater deflections. Greater deflection means more elongation which means higher peak impact tension. Longitudinal and perpendicular stiffness both increase as the string elongates and tension increases, but you get more deflection than elongation for the same perpendicular impact force. For that reason, perpendicular stiffness is always less than longitudinal stiffness. Further, because elongation is so small at low deflections (e.g., A), perpendicular stiffness is almost entirely dependent on pre-impact tension, so all strings of all materials starting at the same tension will have almost the same perpendicular stiffness at very small deflections.
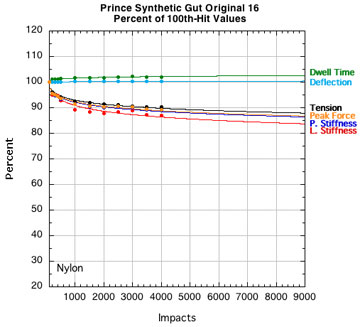
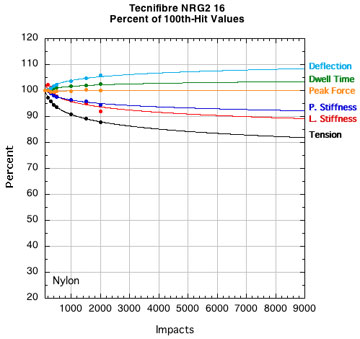
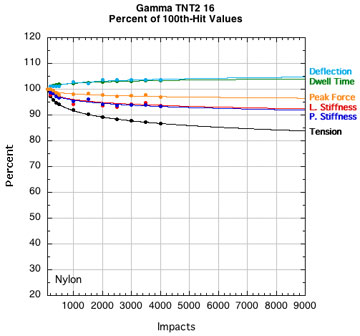
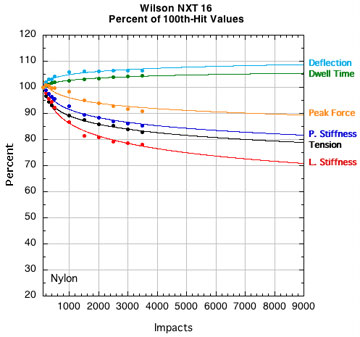
APPENDIX B — INDIVIDUAL STRING PARAMETERS: Perhaps if we look at "fingerprint" plots of the properties of each string, we can identify one parameter that goes whacky compared to others and would indicate a dramatic transition from life to death. Figure 15 shows the parameters for each string plotted as a percent of their starting value (i.e., post-break-in) at 100 hits. All strings start at 100% even though they are all at different post-break-in tensions.
NYLON STRINGS:
POLYESTER STRINGS:
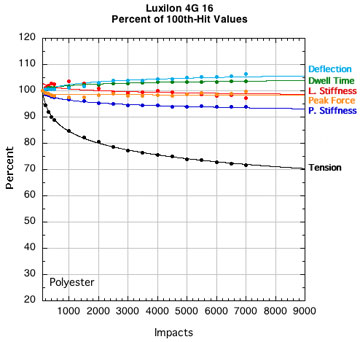
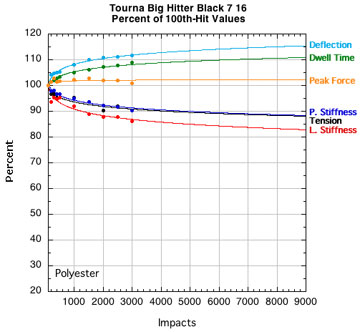
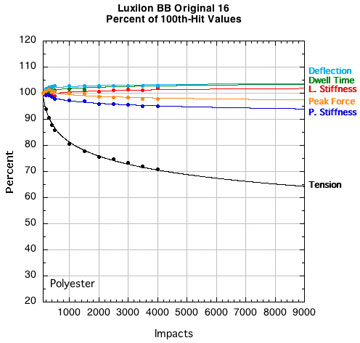
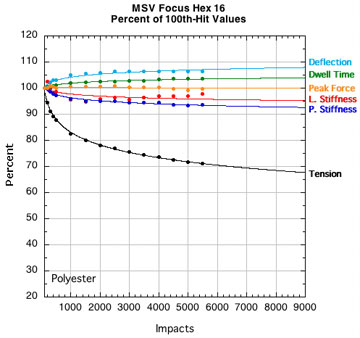

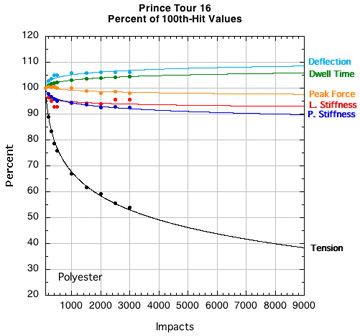
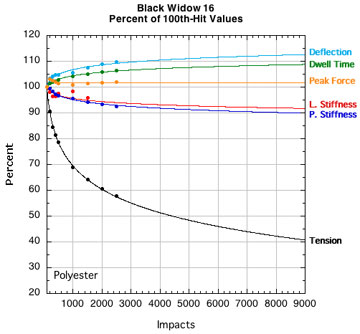
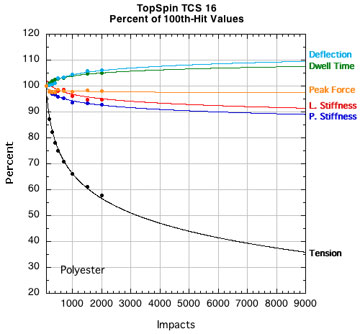
Figure 15 — Change in performance parameters: Nylons and polyesters. Each graph is to the same scale with all logarithmic curve fits extrapolated to fit the axis limits of the extreme cases tested — 9000 hits and 20 percent of the starting tension after 100 hits.
APPENDIX C — INDIVIDUAL STRING FRICTION COEFFICIENTS: Figure 16 displays the combined curves for both static and sliding COF for all strings. This presentation makes it easier to see how the two COFs change relative to each other. Fewer repetitions were performed for the sliding COF tests than the static COF tests. The repetitions for the static tests are listed along the bottom horizontal axis and those for the sliding tests across the upper horizontal axis.
NYLON STRINGS:
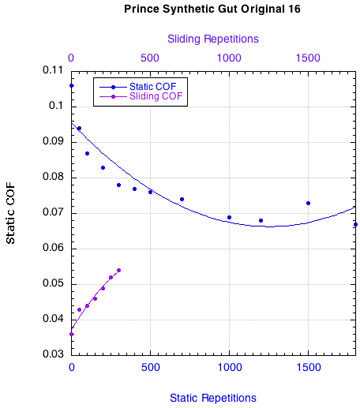
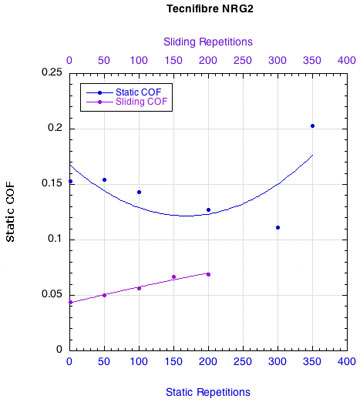
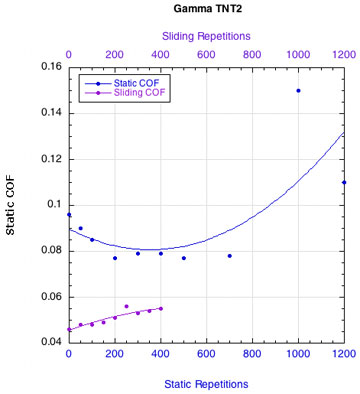
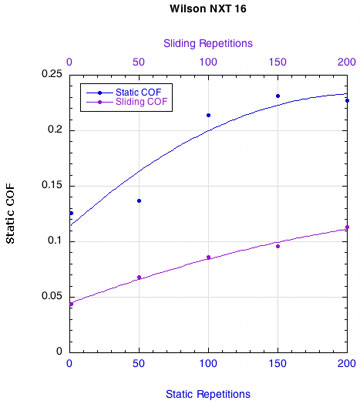
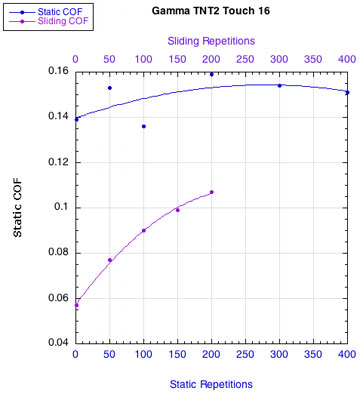
POLYESTER STRINGS:
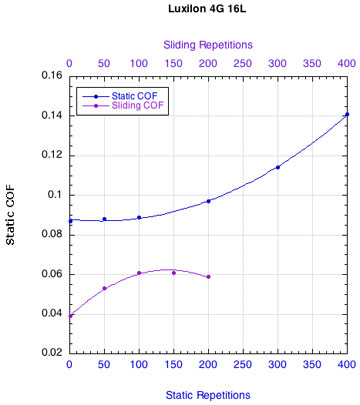
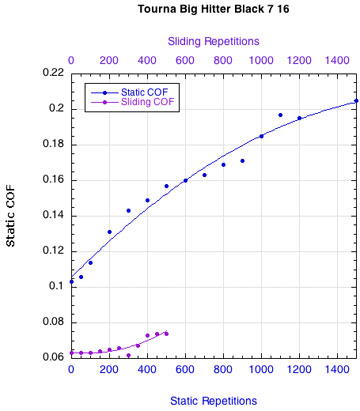
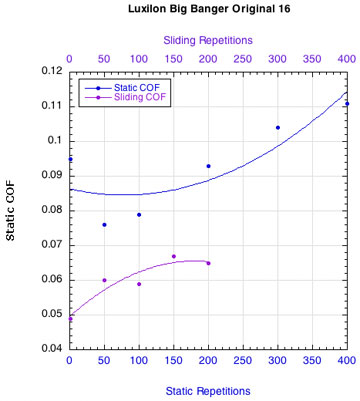
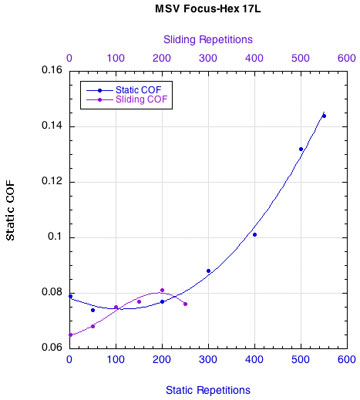
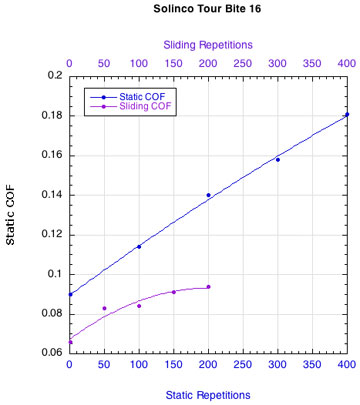

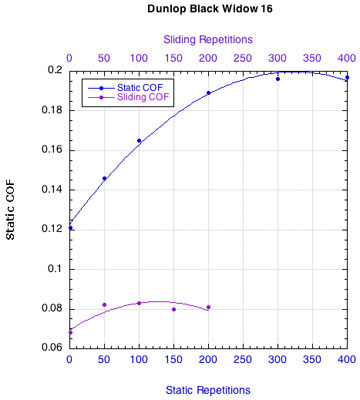
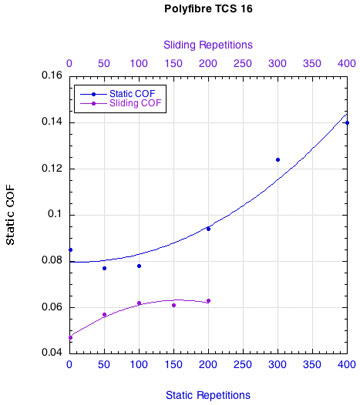
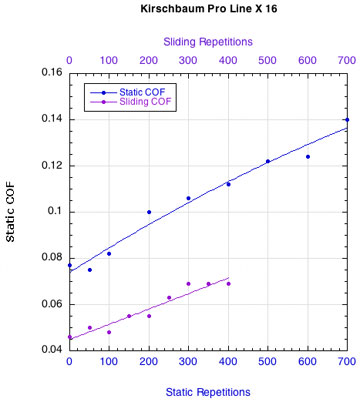
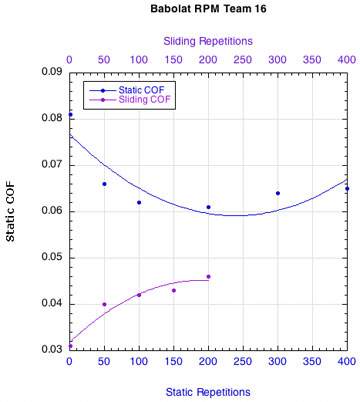
Figure 16 — Change in static and sliding COFs with repetitions for each string: Nylons and polyesters.
Whether it is the static or the sliding friction that is more important remains to be determined. What is clear is that as sliding friction increases, the movement of the strings across each other becomes more "catchy." The movement repeatedly stops and restarts. Consequently, the static and sliding coefficients alternately come into play and more energy is lost as a result.