1. ABSTRACT
Many factors have been offered as influencing spin: string material, tension, gauge, pattern, stiffness, texture, shape, ball-to-string friction, and string-to-string friction. Many of these theories have been addressed elsewhere at TWU (see String Comparison menu above). Here, we will consider the role of string stiffness (as determined by material, tension, and pattern) in spin production. The ITF (International Tennis Federation) conducted tests in 2006 and 2007 concluding that string stiffness was an important factor in spin production.1,2 We will expand on those tests here.
Until recently, the prevailing theory regarding string stiffness and spin has been that the firmness and lateral rigidity of a stiffer string will create more ball-to-string friction due to more squashing and embedding, resulting in more spin. It is true that friction accounts for most of the spin produced by the stringbed, but it does not account for most of the difference in spin between stringbeds. Recent research suggests that lateral main string movement is the most important factor determining this difference ("Which Strings Generate the Most Spin?" and "String Movement and Spin" and "String Snap-Back and Spin"). Consequently, the explanation of how string stiffness might affect the spin differential has changed. The question now becomes, "Does string stiffness affect tangential string movement and its associated storage and return of energy to the ball, both rotationally and translationally? And if so, how much and under what circumstances?" This article presents evidence that string stiffness does affect the magnitude and efficiency of lateral string movement and that it does so most in very open string patterns. In fact, for any given string, there was a 2-6 times more spin between stringbed setups, and for any given setup, there was a 70-400% difference in spin between strings. How can this be?
Movie Screen 1 shows typical differences in spin that occurred in this experiment by changing strings and/or tension and/or pattern.
Movie Screen 1. Spin differences due to changing material, tension, and pattern.
(Note: To see stringbed interaction, movies are best viewed frame by frame using keyboard arrow keys or movie controls.)
2. INTRODUCTION
Bounce Model
The model and terminology for rebounds from the strings are represented in Figure 1.
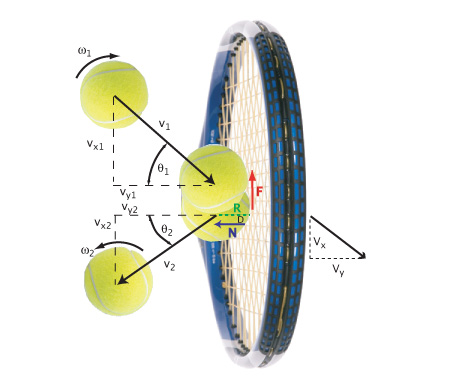
Figure 1 — Bounce Model. Bounce model for ball incident on strings with backspin, sliding across (down) the main strings, and rebounding with topspin.
The symbols represent the following parameters:
- ω1 — The angular velocity (spin) of the incident ball (radians/sec).
- ω2 — The angular velocity of the rebounding ball (radians/sec).
- v1 — Incident velocity of ball (m/s).
- v2 — Rebound velocity of ball (m/s).
- vy1 — Component of incident velocity perpendicular to stringbed (m/s).
- vy2 — Component of rebound velocity perpendicular to stringbed (m/s).
- vx1 — Component of incident velocity parallel to stringbed (m/s).
- vx2 — Component of rebound velocity parallel to stringbed (m/s).
- θ1 — Incident angle measured from perpendicular to stringbed (degrees).
- θ2 — Rebound angle measured from perpendicular to stringbed (degrees).
- F — Friction force acting opposite to the direction of the bottom of the incident ball (Newtons).
- N — Normal reaction force of strings on ball (equal and opposite of force of ball on strings) (Newtons).
- R — Radius of ball = 0.033 m.
- D — The offset distance between a radius to the center of mass and the net action of the normal force (mm)
- Vx — Component of racquet impact point rebound velocity parallel to stringbed (m/s).
- Vy — Component of racquet impact point rebound velocity perpendicular to stringbed (m/s).
String Stiffness
String stiffness will affect the bounce in a number of ways. It affects the share of energy that the ball and string each receive, the energy loss, ball deformation, stringbed deflection, lateral string movement, dwell time, shock, power, peak force, peak tension, ball-to-string friction, string-to-string friction, snap-back force, snap-back time, and the number of friction reversals occurring during contact.3
Upon impact, a stiff string will create a larger force, which, in turn, creates more friction between both the ball and the string and between the strings.
Stiffness is a property of the string.4,5 It is calculated by measuring the force needed to elongate a string by a given amount. A string that requires 100 lb. to elongate 1 inch has a stiffness of 100 lb./in. The formula for stiffness is:

where F is the longitudinal force, x the change in length of the string, and k is the stiffness. As a string stretches, its stiffness changes. The more it stretches the stiffer it gets and the less an equal magnitude of force will elongate the string. Consequently, in an open pattern, fewer strings will resist the impact, stretch further, and become stiffer than in a dense stringbed.
This kind of stiffness due to lengthwise stretching is longitudinal stiffness. There is another kind of stiffness — transverse stiffness. Transverse stiffness is the perpendicular stiffness, as when a ball hits in the middle of a length of string and bends it. Because the string bends perpendicular to its length, we will call this perpendicular stiffness, or kp for short. When the string bends perpendicular to the racquet, we will call that kpn ("perpendicular normal"). When the string bends sideways, parallel to the stringbed, this is also a manifestation of stiffness perpendicular to the long axis of the string, but to differentiate it from kpn we will call it kps (for "perpendicular sideways"). Perpendicular stiffness depends on longitudinal stiffness because in order for a string to bend when anchored at both ends, it must also elongate. In that sense it is a derivative property. In this article, then, we will define "stiffness" as longitudinal stiffness. The distinction is made, however, in order to correctly define terms.
When the ball impacts at an oblique angle and exerts a force on the stringbed, that force can be divided into two component forces acting at a right angle to each other — one perpendicular to the stringbed (Fy) and one parallel to the stringbed (Fx). The string will react to each component with equal and opposite normal (N) restorative force and the friction (F) force, which resists motion of two surfaces relative to each other.
The parallel force component (Fx) will bend the string sideways and, in so doing, move it across the cross string. The main string will resist sideways motion with an equal and opposite elastic restorative force. The cross string will resist the movement of the main with an equal and opposite friction force on the main string.
The restorative forces act to return the string to its original position in each direction and they are proportional to the amount of stretch in each direction, which depends on the kp in both cases.
Energy Return
The string bends normal to the racquet and stores energy to return to the ball in its bounce from the strings. The quantity of energy returned is indirectly measured by the apparent coefficient of restitution (ACOR, or eA),

where vy2 is the bounce speed perpendicular to the racquet and vy1 the incident speed perpendicular to the racquet. (For calculational convenience in racquet impact scenarios, both variables are considered positive even though the directions are opposite.) Whereas eA is simply a unitless ratio of incident and rebound velocities, the square of eA times 100 is the percent of the ball's incident kinetic energy that remains in the rebounding ball. In that sense eA is a proxy for energy return or loss.
The string also (most of the time) bends parallel to the stringbed, storing energy that is returned to the ball by both slowing it (or even reversing the direction in extreme circumstances) and by slowing and reversing its spin. The apparent coefficient of restitution tangential to the stringbed is known as eT6. It is a ratio of the speed at the contact point of the ball relative to the stringbed. Thus it includes the rotational speed of the ball at the contact periphery plus the translational speed of the the ball at its center of mass. The speed of a rotating point about an axis is v = Rω, where v is the linear speed in m/s, R the radius of the ball (0.033 m) and ω is the angular speed of the ball in rad/s. So, the incident speed at the bottom of the ball parallel to the strings will be vx1 + Rω1 and the speed immediately after the bounce will be vx2 - Rω2 and the ratio, eT, will be

Friction, Normal Force, and Spin
During the bounce, the ball and string surfaces slide across each other. If the two surfaces were perfectly rigid there would be no deformation and no elastic storage of energy. In that case, friction would resist the ball's movement across the strings, slowing the ball and reversing the direction of the spin. When the ball first impacts, the direction of the center of mass and a point on the spinning periphery are both the same at the contact point with the strings. As friction does its work, at some point the spin direction will reverse and the ball will slow enough such that the speed and direction of the ball's contact point will be exactly the same but opposite direction as the ball's motion relative to the strings. Thus, the relative speed between the two contact points is zero and sliding friction ceases. At this point, rigid surfaces roll, deformable surfaces bite — i.e., tennis balls and strings. If the ball is rolling, no extra spin will be imparted to the ball. But when non-rigid surfaces deform (laterally, in this case), they store elastic potential energy (kinetic energy of the ball relocated in the stretched string and squashed ball). This energy is available to spin the ball. When the strings begin to snap back to their original position, the ball will once again be moving relative to the strings, so friction will return and once again push backward on the ball, increasing its spin. This double action of friction — before and after bite — only occurs if the strings deform, move, and stretch sideways. It is this extra spin after bite that determines the difference in spin between strings. This is because the results of the before-bite stage is the same for all strings; the results of the after-bite stage depends on the tangential elastic properties of the stringbed setup. A convenient measure of whether or not this extra elastic "overspin" is occurring is the overspin ratio:
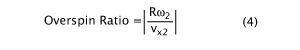
where Rω2 is the speed at the peripheral contact point and vx2 is the speed of the ball (at the CM) relative to the strings. When the overspin ratio is greater than 1.0, there must have been some tangential elastic contribution to both the spin and velocity of the ball. If less than 1.0, the ball probably slid throughout the bounce (i.e., at high impact angles over 50 degrees from the normal). At 1.0, the ball bites the strings.
Spin increase before and after bite both depend on torque to apply off-center forces that cause the ball to rotate. The only forces (ignoring gravity) involved in the motion of the ball across the strings are frictional, tangential to the surfaces, and normal restorative forces, perpendicular to the surfaces. Torque is usually associated with friction, but the normal force can also exert torque if that force is directed off-center of the ball. This latter effect, known as the "normal force offset" (D) is a very important player in the spin story. In this case (topspin production), we will see that it causes a counter-topspin torque.
To derive D7, we begin with the time integral of the friction and normal forces:
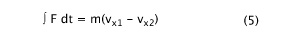
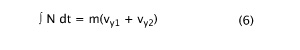
where all v's are considered positive. The moment of inertia about the ball's center of mass is
where α = 0.55 and m = 0.057 kg. Torque = FR-ND and the ball changes spin during the bounce according to the equation FR-ND = Icmdω/dt = Icm(ω2 - ω1), where ω1 is considered as negative and ω2 is considered positive. Combining and substituting we get our equation for normal force offset (D):
We will see that it is the normal force offset that plays a significant role when there is too much string movement, decreasing spin significantly.
3. THE EXPERIMENT
The three main ways to affect the stiffness of each string in a stringbed are by altering material, tension, and pattern. The main ways to affect string movement are by altering tension, pattern and string slipperiness, as measured by the coefficient of static and sliding friction. The experimental goal was to create test situations that both facilitated and constrained movement in both high and low stiffness circumstances. Four scenarios were constructed:
- High movement, low stiffness
- High movement, high stiffness
- Low movement, low stiffness
- Low movement, high stiffness
Extreme ends of the spectrum were chosen in terms of both movement and stiffness to make sure that any string behavior of interest would be observable and would exhibit significant change over the range of test conditions. Such extreme pattern setups would also allow us to see string behavior as if through a microscope — allowing us to see things that might be hidden under more "normal" situations. Several strings were chosen that spanned the slippery/sticky and stiff/soft property ranges. These are displayed in Table 1.
| Table 1 Strings | ||||
| Brand | String | Material | Stiffness at 30 lb. (lb/in) | Stiffness at 60 lb. (lb/in) |
|---|---|---|---|---|
| Babolat | RPM Blast 16 | Polyester | 233 | 304 |
| Luxilon | Big Banger Rough 16 | Polyester | 198 | 276 |
| Polyfibre | TCS 16 | Polyester | 166 | 227 |
| Prince | Synthetic Gut w/Duraflex 16 | Nylon | 159 | 206 |
| Tecnifibre | X-One Biphase 16 | Nylon | 148 | 190 |
Table 1 — Strings used in the experiment.
The strings were then installed into four setups in Prince EXO3 Hybrid Red 102 racquets:
- 16 mains by 10 crosses at 30 pounds (16x10 30)
- 16 mains by 10 crosses at 60 pounds (16x10 60)
- 16 mains by 19 crosses at 30 pounds (16x19 30)
- 16 mains by 19 crosses at 60 pounds (16x19 60)
The 16Mx10X pattern was achieved by skipping every other cross string. Figure 2 shows the resulting pattern.
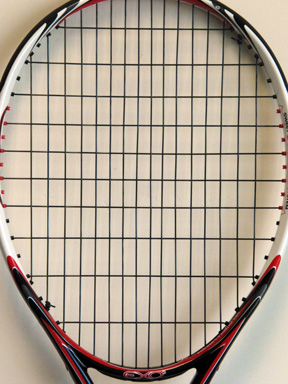
Figure 2 — 16x10 string pattern resulting from skipping every other cross and used to accentuate string behavior and to make it more observable.
I am told by the ITF that such a pattern is legal for play because it abides by the ITF equipment rules that state, "The stringing pattern must be generally uniform and, in particular, not less dense in the centre than in any other area."
So, for a given pattern, stiffness (and movement) was modulated by tension and friction, and for a given tension, stiffness (and movement) was modulated by pattern and friction.
The stiffness of the string was measured on a specially designed device for that purpose. Experiments were previously performed to determine the longitudinal (lengthwise) stiffness of each string at reference tensions of 62, 51, and 40 pounds at calibrated "high," "medium," and "slow" impact speeds. The racquet setups below do not exactly correspond to these tests. They were close enough to use for our purposes here. The stiffness values applied here were as follows: analysis of the 30 pound setups used the "40 lb-medium speed" stiffness test and the 60 lb. setups used the "62 lb-medium speed" stiffness test.
Lines were drawn with a felt-tip pen around the circumference of tennis balls in order to measure spin. Balls were fired at a nominal angle of 28 degrees from perpendicular to the stringbed using a ball machine with an indicated speed of 47 mph and "high spin." Due to variances in the actual launch mechanism, the angle was 28 +/- 1 degree, the speed was 49 +/- 1 mph (22 m/s +/- .447 m/s), and the spin was -3150 +/- 286 rpm (330 rad/s +/- 30 rad/s).
The impact angle of 28 degrees was chosen as typical of an average topspin shot. At lesser angles (flat shot), less spin would be evident. Spin increases up to about 45-50 degrees and then declines beyond that. The actual angle of impact in the racquet's frame of reference is determined by swing angle and speed, racquet face tilt, and ball angle and speed. These inputs combine in a typical topspin shot for an incident angle well below 45 degrees. Also, at angles below 45 degrees the ball will bite and sliding friction will cease. In this situation, if spin continues to increase, it must be from torque created by elastic forces and not just from the sliding friction between the two surfaces. This helps us analyze the effects of the string movement and stiffness without worrying too much about confusing it with the effects of friction.
The ball impacts with backspin because, to the racquet, a ball bouncing with topspin from the court hits the racquet with backspin when seen from the racquet frame of reference (this assumes that the relative motion of the ball is from high to low across the racquet, as in most heavy topspin stokes).
The launch speed was chosen to be fast enough to ensure ample string interactions, enable filming, and too some extent was simply dictated by the logistics of apparatus and logistics.
Even though the variances in input parameters were small, they can be important. Spin varies more due to changes in incoming spin, speed and angle than it does due to changes in string properties. Therefore these variances have to be controlled for. This was done by normalizing the raw data. Normalization procedure is discussed in detail in the article "Which Strings Generate the Most Spin" under the heading of "Normalization Experiments." Suffice it to say that the parameters eT, D and eA stay relatively constant over small ranges of input variance (i.e., the range of variance between nominal and actual impact parameters) and thus can be used to calculate the spin as if the inputs were exactly 28 degrees, 48 mph, and -3150 rpm. The actual measured values of eT, D and eA for each impact are then used to calculate what the spin would have been had the impact occurred at exactly the desired incident angle, speed, and spin.
The impacts were filmed at 420 fps from the side, parallel to the trajectory of the ball. Twenty to fifty impacts of each setup were filmed with the best (in terms of orientation of the equatorial lines drawn on the ball and impact location on the strings) 12-15 measured and analyzed. This fairly large measuring sample was chosen to average out some of the large variances in spin that occur with all setups, but especially the 16x10 30 lb. setup. The experimental setup is shown in Movie Screen 2.
Movie 2
Experimental Setup
Movie Screen 2. Experimental Setup. Balls fired by ball machine at a stationary but free-swinging racquet rotating about an axis 3.5 inches from the end of the racquet and about its longitudinal axis.
(Note: To see stringbed interaction, movies are best viewed frame-by-frame using keyboard arrow keys or movie controls.)
4. ANALYSIS
Results Summary
The graphs in Figure 3 show the spin for each setup for the five strings and a composite graph of all strings and setups together.
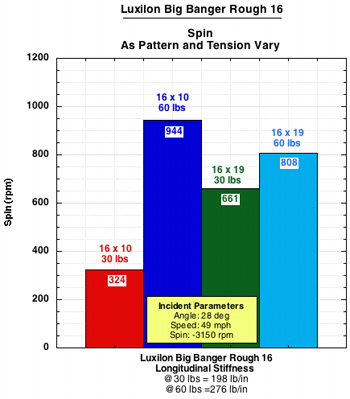
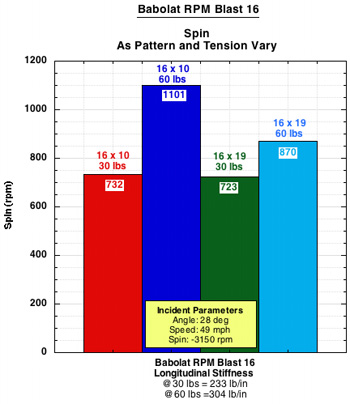
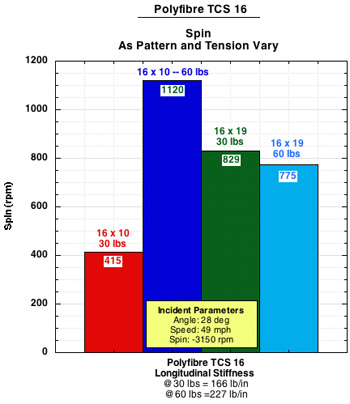
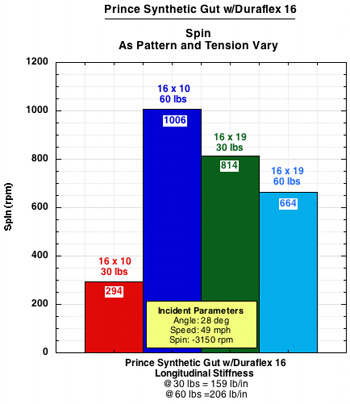
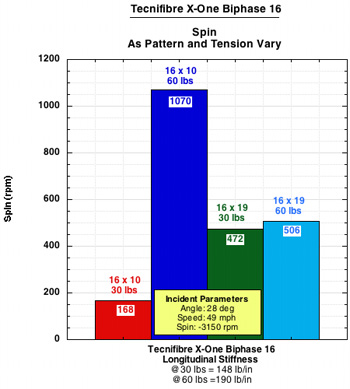
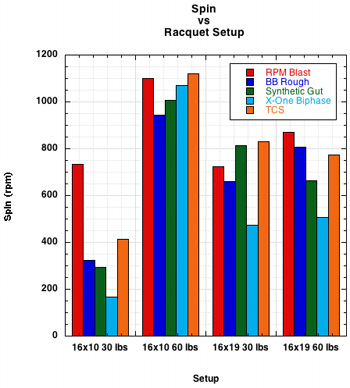
Figure 3 — Spin results for each string and setup and a composite of all strings at each setup.
Table 2 shows the percentage difference in spin from the least to the most for each setup; Table 3 shows the percentage difference from least to most spin for each string; Table 4 shows the difference between the 16x19 patterns (i.e., the "normal" patterns) for each string.
| Table 2 Percentage Difference Between Strings with the Least and Most Spin by Setup | |||
| 16x10 30 lbs | 16x10 60 lbs | 16x19 30 lbs | 16x19 60 lbs |
|---|---|---|---|
| 335% | 19% | 76% | 72% |
Table 2 — Percentage difference between least and most spin by setup for all strings. These numbers represent the difference between the highest spin for all strings as a group at each setup compared to the lowest of all strings as a group. This is the difference in spin you can get just by changing string for any particular tension/pattern setup.
| Table 3 Percentage Difference Between Least and Most Spin Setups for Each String | ||||
| Babolat RPM Blast | Luxilon Big Banger Rough | Polyfibre TCS | Prince Synthetic Gut w/Duraflex | Tecnifibre X-One Biphase |
|---|---|---|---|---|
| 52% | 191% | 170% | 242% | 536% |
Table 3 — Percentage difference between least and most spin by string for all setups. These numbers represent the percentage difference in spin from lowest to highest for each string as measured over all setups. This is the spin difference you can get by changing the setup of a string.
| Table 4 Percentage Spin Difference 16x19 60 lb. to 16x19 30 lb. Setups | ||||
| Babolat RPM Blast | Luxilon Big Banger Rough | Polyfibre TCS | Prince Synthetic Gut w/Duraflex | Tecnifibre X-One Biphase |
|---|---|---|---|---|
| 20% | 22% | -7% | -23% | 7.2% |
Table 4 — Percentage difference between 16x19 60 lb. and 16x19 30 lb. setups. Because 16x19 is a very common pattern, not like the radical 16x10 pattern, the percentages here represent the kind of spin difference players are most likely familiar with on court. These numbers represent the change in spin you can get from each string just by changing tension within a 16x19 setup.
Two things immediately stand out. The first is that the 16x10 60 lb. pattern creates the most spin for each string. And second, the 16x10 30 lb. setup has by far the least amount of spin of any setup, except in the case of the Babolat RPM, where it still produces the least spin, but at twice the level as the other strings. The 16x19 setups produce a medium amount of spin, with the 60 and 30 lb. versions trading places back and forth for most spin output.
These findings are somewhat surprising and confounding. If spin depends on lateral string movement, and thus low friction between strings, one might expect that the 16x10 30 lb. setup would produce the most spin, having fewer strings and lower tension. This was not the case.
Furthermore, if we thought low inter-string friction was most important to facilitating string movement and spin, then we might have figured that smooth polyesters would be best and that the setups would produce decreasing spin in this order: 16x10 30, 16x10 60, 16x19 30, 16x19 60. In some instances (TCS and Synthetic Gut) this is almost the case, but not in others.
Too Much String Movement
So the first question we want to answer is why, contrary to some expectation, does the 16x10 30 lb. setup produce the least spin? The photos in Figure 4 reveal several cases of adverse effects in this setup.
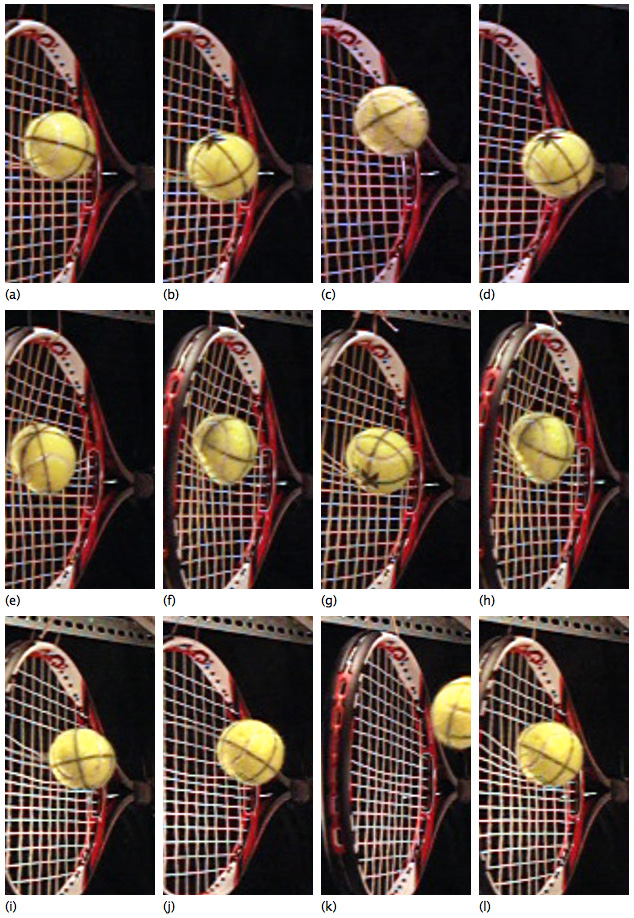
Figure 4 — Energy loss. Examples of string movement and deflection that contribute to tangential energy loss.
The above photos display a number of inefficient energy return phenomena with regard to creating spin-producing torque.
- Late snap (a) and (b). Very little of the stored energy in the laterally displaced strings is given back to the ball.
- Overshoot (c) and (d). The main string(s) has snapped back beyond the original position, indicating inefficient transfer of energy to the ball. This is also indicative of a late snapback.
- Reverse snap (e). The main string just above the ball has been moved in the opposite direction, exerting a counter torque to the other mains.
- Ramp effect (f). The ball plows forward into the stringbed pushing string in front of it, forming a ramp to climb, causing more slowing in the tangential direction, and a steeper bounce.
- Torque into push effect (g) and (h). The strings are pushed under and in front of the ball and up against the ramp. This combination redirects the force from directly backwards across the bottom of the ball to diagonally back and up into the ball. This reduces torque (even reverses it if the line of force is in front of the center of mass) and slows the ball more parallel to the strings.
- Chaos and entropy (i). This simply shows several of the energy loss effects together making up a particularly messy view of the strings as the ball rebounds.
- Late snap and overshoot combo (j). This photo shows a simultaneous late (or no) snap (lower string) with an over-snap (upper string).
- Sticking strings (k). As the ball approaches, strings are shown stuck out of position, having not snapped back from previous impacts.
- Normal force offset (l). This is perhaps the most important effect of all and is discussed in more detail below. Virtually all the examples where the ball is on the strings show this effect. When the main strings are pushed forward past the middle of the ball, the normal (perpendicular to the stringbed) force components contributed by these strings are pushing upward in front of the ball's center of mass. This creates a torque that acts counter to the friction torque that is acting to create topspin. The farther these mains are moved forward, the more the counter-topspin torque.
These energy loss effects are particularly apparent in the 16x10 30 lb. setups. The other patterns each, in their own way, minimize these effects and therefore produce more topspin. But they are not immune from such effects and each setup has its own dominating spin inefficiencies, involving too much friction or not enough tangential force — except, compared to the rest, the 16x10 60 lb. setup, which produces the most spin for all strings.
Normal Force Offset — Counter-torque
The photos in Figure 4 reveal many inefficient string movements vis-à-vis spin production. In particular, a look at the normal force offset parameter (symbolized by "D") is very instructive as to when you can have too much movement, even if late snap, overshoot, reverse snap, sticking strings, etc. do not occur. As indicated in (l) above, when the main strings are pushed downward and forward in front of the ball, their upward, normal force is then located in front of the center of mass, causing a counter-topspin torque. This is seen in Figure 5.
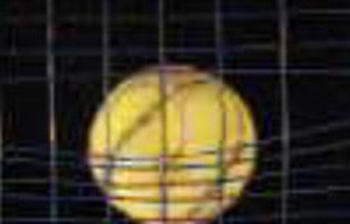
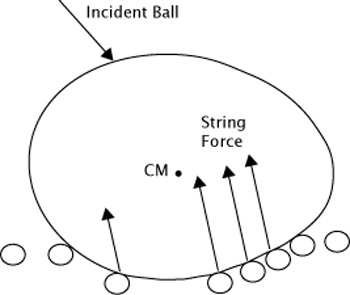
Figure 5 — Main strings being pushed in front of ball exerting a torque against topspin and slowing the ball's motion across the strings (vx2).
Graphic evidence of this normal force offset, or "D-effect", is shown in Figure 6.
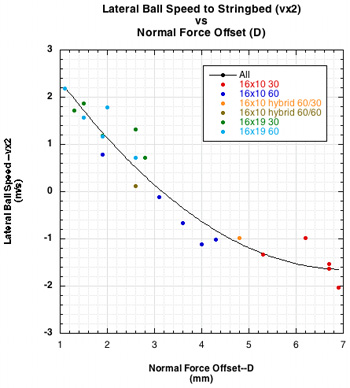
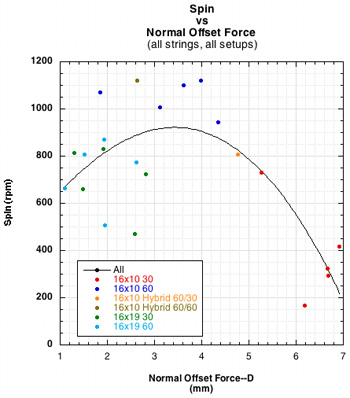
Figure 6 — The ball deforms the stringbed and plows forward creating a ramp in front of it slowing the ball (left). As main strings get pushed farther to the front of the ball, they exert more upward force in front of the center of mass (CM), exerting a counter torque and reducing topspin (right).
The normal force offset is not the same thing as the amount of string movement forward. It is an indicator of movement but it is not the movement. The normal force is the reaction force by the strings to the force pushing them perpendicular to the plane of the stringbed. Each string will feel a different force depending on its location vis-a-vis the impact. Each string will push back with equal and opposite force to that pushing on it. Part of the reactive force will be upward, perpendicular to the stringbed, and is the normal force component of the reaction force. The other component is parallel to the stringbed and is the friction force. The normal force for the stringbed will be the summation of each string's normal component. This summed force will move to the front of the ball as the strings move forward. String movement is not the only contributor to this forward offset. As the ball impacts and is immediately slowed parallel to the stringbed, the bottom of the ball will slow down faster than the top. This will cause the top to stretch and rotate forward, pressing with greater force into the strings in the front of the ball than in the back, where the spin is moving the ball up and off the strings.
The graph on the left of Figure 6 shows that the greater the normal force offset, the slower the tangential ball speed. The graph on the right shows that spin first increases at lower values of D, and then around 4 mm begins to decline. As more strings move farther forward, the force slowing the ball increases. This is the same tangential force that causes topspin. However, as D increases, this tangential force is countered by the increasing counter-torque supplied by the offset of the normal force, thus diminishing topspin. As the strings move tangentially they store energy, but not as much as is stored perpendicularly. Hence, as D moves too far forward, increasing counter-torque will diminish the effects of the snapback and its return of the tangentially stored energy. For these setups, the optimal relationship between upward and backward forces occurs when D is about 4 mm.
Further evidence of the role of string movement in determining how much stored tangential energy is used to (1) slow the ball and increase the bounce angle and (2) to increasing spin is presented in Figure 7.
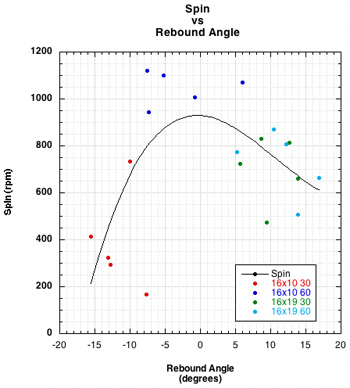
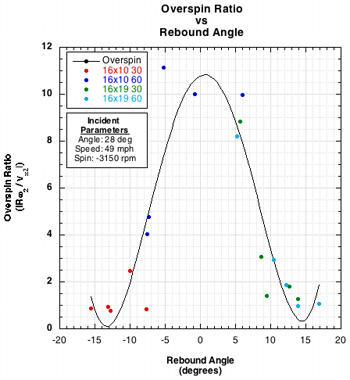
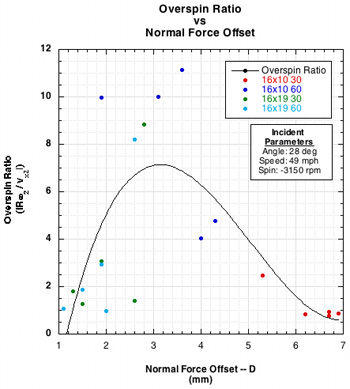
Figure 7 — D-Effect: As main strings are pushed forward, the normal force is also pushed forward in front of the ball's center of mass and creates a torque counter to topspin. This also slows the velocity across the strings, vx, which in turn increases the rebound angle (negative rebound angle is high launch in this graph). When there is too much movement, more energy is going into slowing the ball than spinning it, so the rebound angle is small or backwards, the spin minimal, and the overspin ratio low, because spin is low. When the main string barely moves, little tangential energy is stored nor given back, so rebound angle to the horizontal increases and spin declines. Somewhere between those extremes, just enough string movement takes place to store and give back energy to increase and/or maximize topspin.
Rebound Angle
When the main strings get pushed forward, they slow the ball across the stringbed. They can even reverse the speed. This slowing becomes manifest in rebound angle. If the ball slows a great deal, it can bounce backwards in the direction from which it came. This creates a high launch angle. If the ball does not slow at all, the rebound angle will be close to the same as the incident angle. The average rebound angle for each setup appears in Figure 8, showing a range from the lowest to highest average rebound angles of almost 24 degrees.
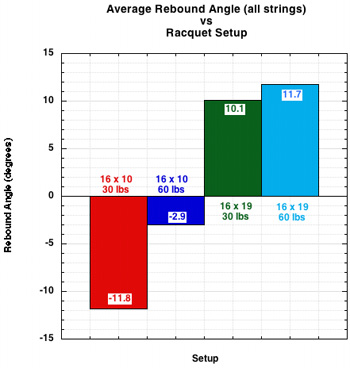
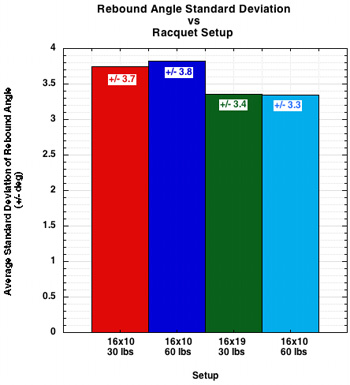
Figure 8 — Rebound Angle by Setup.
The negative rebound values represent a backward bounce — i.e., the ball reverses directions both laterally and perpendicularly. The actual rebound angle will also depend on the speed and direction of your stroke — it is the combined result of the speed and angle of the bounce plus speed and angle of the swing.8 The magnitudes of the swing parameters are usually greater than the bounce parameters and thus dominate in determining the final trajectory. Therefore, the actual range in launch angles will not be as large as 24 degrees. The difference between backward and forward bounces can be seen in Movie Screen 3. The backward bounce is for Polyfibre TCS with a 16x10 30 lb. setup and the forward bounce for Tecnifibre X-One Biphase at 16x19 60 lbs.
Movie Screen 3. Forward and Backward Rebound Bounces.
(Note: To see stringbed interaction, movies are best viewed frame-by-frame using keyboard arrow keys or movie controls.)
As an interesting aside, when speaking of rebound angle, there is a curious effect concerning off-axis impacts. It is commonly thought that a high (3 o'clock) off-center hit will cause the racquet to rotate backwards, thereby causing the ball to rebound at a higher angle. As shown in the experiment "Spin and Material," the rebound angle is not necessarily affected. The rebound speed is, but not the angle. One reason for this can be seen in Movie Screen 4. If you step through the movie one frame at a time, you will see that upon first contact with the strings, the strings deform both perpendicularly and tangentially, with barely a trace of movement from the racquet. There is a little movement in the second frame of impact and the ball is gone on the third. The racquet acceleration does not get the racquet up to any significant backward speed until the ball has left. This movie is not set up to prove or disprove the effect on the angle, so don't try to analyze the bounce. The point is just to show the stringbed and racquet response that accounts for the fact rebound angle is not affected.
Off-Axis Rebound
Movie Screen 4. Off-axis Rebound. Strings deform and rebound before racquet can rotationally accelerate backward very much.
(Note: To see stringbed interaction, movies are best viewed frame-by-frame using keyboard arrow keys or movie controls.)
Spin and Stiffness
If the 16x10 30 lb. setup is so poor at producing spin, why is the 16x10 60 setup so effective? The only thing we are changing is tension, or stiffness. A higher tension string requires more force to deflect it a given amount — i.e., it is stiffer and it will be harder to stretch and move it sideways. It will also press the strings together with greater force, thus increasing inter-string friction and also making it more difficult to move the string sideways. But we saw that we had too much sideways movement in the 16x10 30 pattern. What we will see is that in the 16x10 60 lb. setup we get less but more efficient movement. We maximize the storage and return of energy by modulating movement with stiffness. Movie Screen 5 shows typical impacts for 4 strings in a 16x10 60 lb. setup.
Movie Screen 5. Typical impacts for 16x10 60 lb. setups.
(Note: To see stringbed interaction, movies are best viewed frame-by-frame using keyboard arrow keys or movie controls.)
Compared to the 16x10 30 lb. setup, it is evident that the main strings do not move laterally quite as far, are more evenly spaced under the ball, and snap back much sooner. We don't see the same chaotic string behavior as we do at 30 lbs. There is a more efficient return of tangential energy to the ball and there is not a large anti-topspin torque created by a large normal force offset. As we add more strings in the 16x19 pattern, the interactions and trade-offs between normal force, friction force, and inter-string friction force, energy loss, and normal force offset become more complicated and their effects begin to neutralize each other. Hence, spin is more similar for each string with the 16x19 setups.
Figure 9 shows the relationship between spin and stiffness.
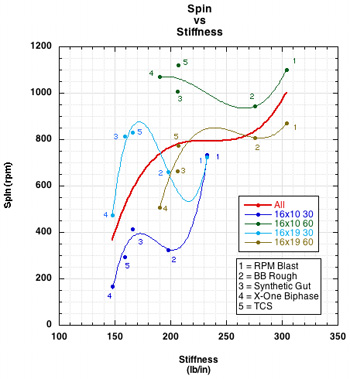
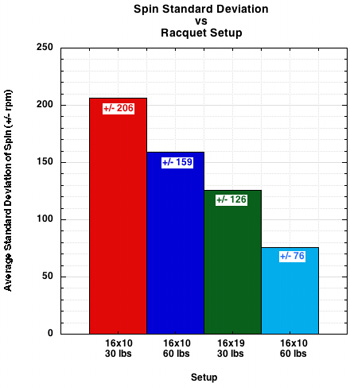
Figure 9 — Spin and Stiffness by setup and standard deviation of spin.
As shown in Figure 9, in general, as stiffness goes up, spin goes up. The trend for each setup as well as all setups taken together (the red curve fit line) is upward. The dip in the fit lines for each setup occur for the Big Banger Rough string, which is, as its name implies, a textured string with a higher coefficient of friction. So, even though that string is very stiff, it generates so much inter-string friction due to its texture that lateral string movement back and forth is constrained in a spin-debilitating manner. A hallmark of spin generation is its variability from impact to impact, even when all input variables appear the same. The graph of standard deviations shows this. Variability declines as tension and pattern density increase.
Role of Cross Strings
Does the tension in the cross strings affect spin? To investigate that, two 16x10 hybrid (Ashaway Crossfire Kevlar mains and Babolat RPM Blast crosses) setups were prepared. One racquet had 60 lb. mains and 60 lb crosses and the other had 60 lb mains and 30 lb crosses. The idea was two-fold: first to create a very spin friendly setup (i.e., super-stiff mains sliding on stiff, slippery crosses in a very open pattern), and second to see if altering just the cross string tension in such a setup would matter. No attempt was made to test the 16x19 patterns also. Figure 10 displays the results.
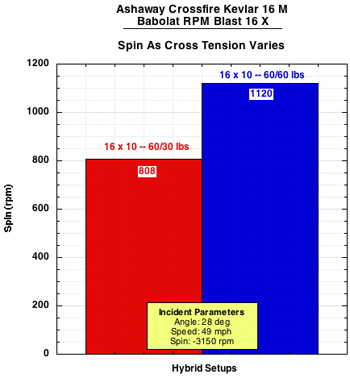
Figure 10. Spin and cross string tension.
The cross strings at 60 lb. produced almost 40% more spin than the 30 lb. crosses. The greater inter-string friction due to higher cross tension probably constrained the mains from moving too far forward and creating a large normal force offset.
Data
Table 5 presents the normalized averages for each string and setup.


Normalized Results
| Brand | String | Material | Pattern | Tension MxX | θ1 (deg) | v1 (m/s) | ω1 (rpm) | vx2 (m/s) | eA | eT | D (mm) | θ2 (deg) | ω2 (rpm) | SD ω2 (rpm) |
|---|---|---|---|---|---|---|---|---|---|---|---|---|---|---|
| Babolat | RPM Blast 16 | Polyester | 16x10 | 30 | 28 | 49 | -3150 | -1.33 | 0.38 | .182 | 5.26 | -10 | 732 | 235 |
| Babolat | RPM Blast 16 | Polyester | 16x10 | 60 | 28 | 49 | -3150 | -0.67 | 0.37 | 0.211 | 3.6 | -5.2 | 1101 | 167 |
| Babolat | RPM Blast 16 | Polyester | 16x19 | 30 | 28 | 49 | -3150 | 0.71 | 0.36 | 0.084 | 2.8 | 5.7 | 723 | 159 |
| Babolat | RPM Blast 16 | Polyester | 16x19 | 60 | 28 | 49 | -3150 | 1.17 | 0.33 | 0.087 | 1.9 | -5.2 | 870 | 115 |
| Luxilon | Big Banger Rough 16 | Polyester | 16x10 | 30 | 28 | 49 | -3150 | -1.53 | 0.34 | 0.125 | 6.7 | -13.1 | 324 | 221 |
| Luxilon | Big Banger Rough 16 | Polyester | 16x10 | 60 | 28 | 49 | -3150 | -1.01 | 0.39 | 0.201 | 4.3 | -7.3 | 944 | 193 |
| Luxilon | Big Banger Rough 16 | Polyester | 16x19 | 30 | 28 | 49 | -3150 | 1.87 | 0.39 | 0.02 | 1.5 | 13.9 | 661 | 115 |
| Luxilon | Big Banger Rough 16 | Polyester | 16x19 | 60 | 28 | 49 | -3150 | 1.56 | 0.38 | 0.058 | 1.5 | 12.2 | 808 | 54 |
| Polyfibre | TCS 16 | Polyester | 16x10 | 30 | 28 | 49 | -3150 | -2.03 | 0.37 | 0.163 | 6.9 | -15.5 | 415 | 248 |
| Polyfibre | TCS 16 | Polyester | 16x10 | 60 | 28 | 49 | -3150 | -1.11 | 0.41 | 0.235 | 4.0 | -7.6 | 1120 | 109 |
| Polyfibre | TCS 16 | Polyester | 16x19 | 30 | 28 | 49 | -3150 | 1.19 | 0.40 | 0.079 | 1.9 | 8.7 | 829 | 119 |
| Polyfibre | TCS 16 | Polyester | 16x19 | 60 | 28 | 49 | -3150 | 0.71 | 0.40 | 0.093 | 2.6 | 5.2 | 775 | 45 |
| Prince | Syn Gut w/Duraflex 16 | Nylon | 16x10 | 30 | 28 | 49 | -3150 | -1.6 | 0.38 | 0.125 | 6.7 | -12.8 | 294 | 300 |
| Prince | Syn Gut w/Duraflex 16 | Nylon | 16x10 | 60 | 28 | 49 | -3150 | -0.11 | 0.38 | 0.169 | 3.1 | -0.8 | 1006 | 151 |
| Prince | Syn Gut w/Duraflex 16 | Nylon | 16x19 | 30 | 28 | 49 | -3150 | 1.72 | 0.40 | 0.051 | 1.3 | 12.7 | 814 | 115 |
| Prince | Syn Gut w/Duraflex 16 | Nylon | 16x19 | 60 | 28 | 49 | -3150 | 2.19 | 0.37 | 0.005 | 1.1 | 16.9 | 665 | 98 |
| Tecnifibre | X-One Biphase 16 | Nylon | 16x10 | 30 | 28 | 49 | -3150 | -0.99 | 0.38 | 0.074 | 6.2 | -7.7 | 168 | 255 |
| Tecnifibre | X-One Biphase 16 | Nylon | 16x10 | 60 | 28 | 49 | -3150 | 0.79 | 0.39 | 0.137 | 1.9 | 6.0 | 1070 | 175 |
| Tecnifibre | X-One Biphase 16 | Nylon | 16x19 | 30 | 28 | 49 | -3150 | 1.31 | 0.40 | 0.015 | 2.6 | 9.5 | 472 | 121 |
| Tecnifibre | X-One Biphase 16 | Nylon | 16x19 | 60 | 28 | 49 | -3150 | 1.79 | 0.37 | -0.002 | 2.0 | 13.9 | 507 | 71 |
Table 5 — Normalized Results.
5. CONCLUSION
The optimization rules for spin appear to be "Goldilocks Principles": the stringbed must be not too soft and not too stiff, not too closed and not too open, and not too rough and not too smooth. You can have too much or too little of each. Stiffness helps keep movement in check in open patterns and helps to overcome friction in tighter, higher friction environments. But stiffer materials and higher tensions also create greater inter-string friction and may too severely constrain lateral string movement, thus not getting the maximum spin benefit.
The 16x10 60 lb. setup produced the most spin. It also had the least variability between strings — the lowest to the highest spin producer was separated by only 19%. Other setups had 70-300% differences between strings in spin production. This setup combines high tension and open spacing. Each string, whether sticky, rough, or slippery excelled with this setup. Table 6 shows how superior this setup was to all others for each string. The percentages shown in the table are the percent extra spin produced by the 16x10 60 lb. setup compared to its closest competitor for each string.
| Table 6 16x10 60 lb. Setup — Spin Difference To Next Best Setup for Each String | ||||
| Babolat RPM Blast | Luxilon Big Banger Rough | Polyfibre TCS | Prince Synthetic Gut w/Duraflex | Tecnifibre X-One Biphase |
|---|---|---|---|---|
| 27% | 17% | 35% | 24% | 111% |
Table 6 — Spin Difference to next best setup.
But is this a viable pattern to play with? Or is a similar but slightly different setup better? Is there enough control, consistency? As the eA column in Table 5 shows, power is essentially the same for all setups, the difference mostly being from slight variations in impact location on the racquet. But, still, is it playable?
For the purposes of this experiment, the answer to that question does not really matter. Comparing the data from that setup with others has revealed processes that would be difficult to identify and measure otherwise, and the setup also helped us to see what wasn't happening in certain circumstances with other setups.
We thus can't make any categorical rules about spin. We can't say, for example, that stiffer, slipperier, or more open always creates more spin. It depends on "compared to what?" If you are already getting too much string movement, changing to a setup that gives more movement will give you less spin. And if you don't have very much movement, changing to a stiffer, tighter, stickier setup isn't going to help.
What we can say about spin and stiffness (and with it pattern, friction, and movement) is summarized in the following list of the major findings of this experiment:
- String movement increases spin.
- Too much string movement decreases spin.
- The normal force offset increases with lateral string movement and creates a counter-topspin torque.
- High normal force offset decreases spin.
- Spin depends on the amount, timing and efficiency of the lateral string movement.
- As string tension/stiffness increases, spin increases.
- A stiffer string contributes to the efficiency of the energy return of the lateral string movement.
- High normal force offset due to string movement causes higher rebound angle.
- Consistency of bounce increases with stringbed stiffness.
- High cross string tension can prevent excessive string movement in very open patterns.
- The Open, stiff, 16x10 60 lb. setup was superior in all cases for producing spin.
- The 16x10 30 lb. setup was the worst in all cases.
- All strings performed most similar to each other in the 16x10 60 pattern.
- The greatest variability between strings was in the 16x10 30 lb. setup.
- The trade-off between too-much/too-little friction and too-much/too-little stiffness was optimized in the 16x10 60 lb. setup.
- Stiffer strings tend to be slippery strings (i.e., polyester).
References
1 S. Goodwill, J. Douglas, S. Miller and S. Haake, "Measuring ball spin off a tennis racket," In
Proc. of the 6th Int. Conf. on the Engineering of Sport (ed. F. Moritz and S.J.Haake), Springer,
New York (2006). Vol. 1, 379-384.
2 S. Miller, "The role of ITF Science & Technical in evaluating and regulating tennis equipment,"
In Proc. of the 3rd Int. Conf. on Tennis Science & Technology (ed. S. Miller & J. Capel-Davies),
1-19 ( 2007).
3 H. Brody, R. Cross and C. Lindsey, The Physics and Technology of Tennis, Racquet Tech
Publishing, Solana Beach (2002), 294-296, 369-380.
4 H. Brody, R. Cross and C. Lindsey, The Physics and Technology of Tennis, Racquet Tech
Publishing, Solana Beach (2002), 271-282.
5 R. Cross and C. Lindsey, Technical Tennis, Racquet Tech
Publishing, Vista (2005), 61-73.
6 R. Cross, "Measurements of the horizontal coefficient of restitution for a superball and a tennis
ball," Am. J. Phys. 70, 482-489 (2002).
7 R. Cross, "Grip-slip behaviour of a bouncing ball," Am. J. Phys. 70, 1093-1102 (2002).
8 R. Cross and C. Lindsey, Technical Tennis, Racquet Tech
Publishing, Vista (2005), 108-117.
Related Tennis Warehouse University (TWU) Web Pages
1 "Which Strings Generate the Most Spin?"
2 "String Movement and Spin"
3 "String Snap-Back and Spin"
4 "Spin and String Pattern"
5 "Sliding Friction and Spin"
6 "Static Friction and Spin"